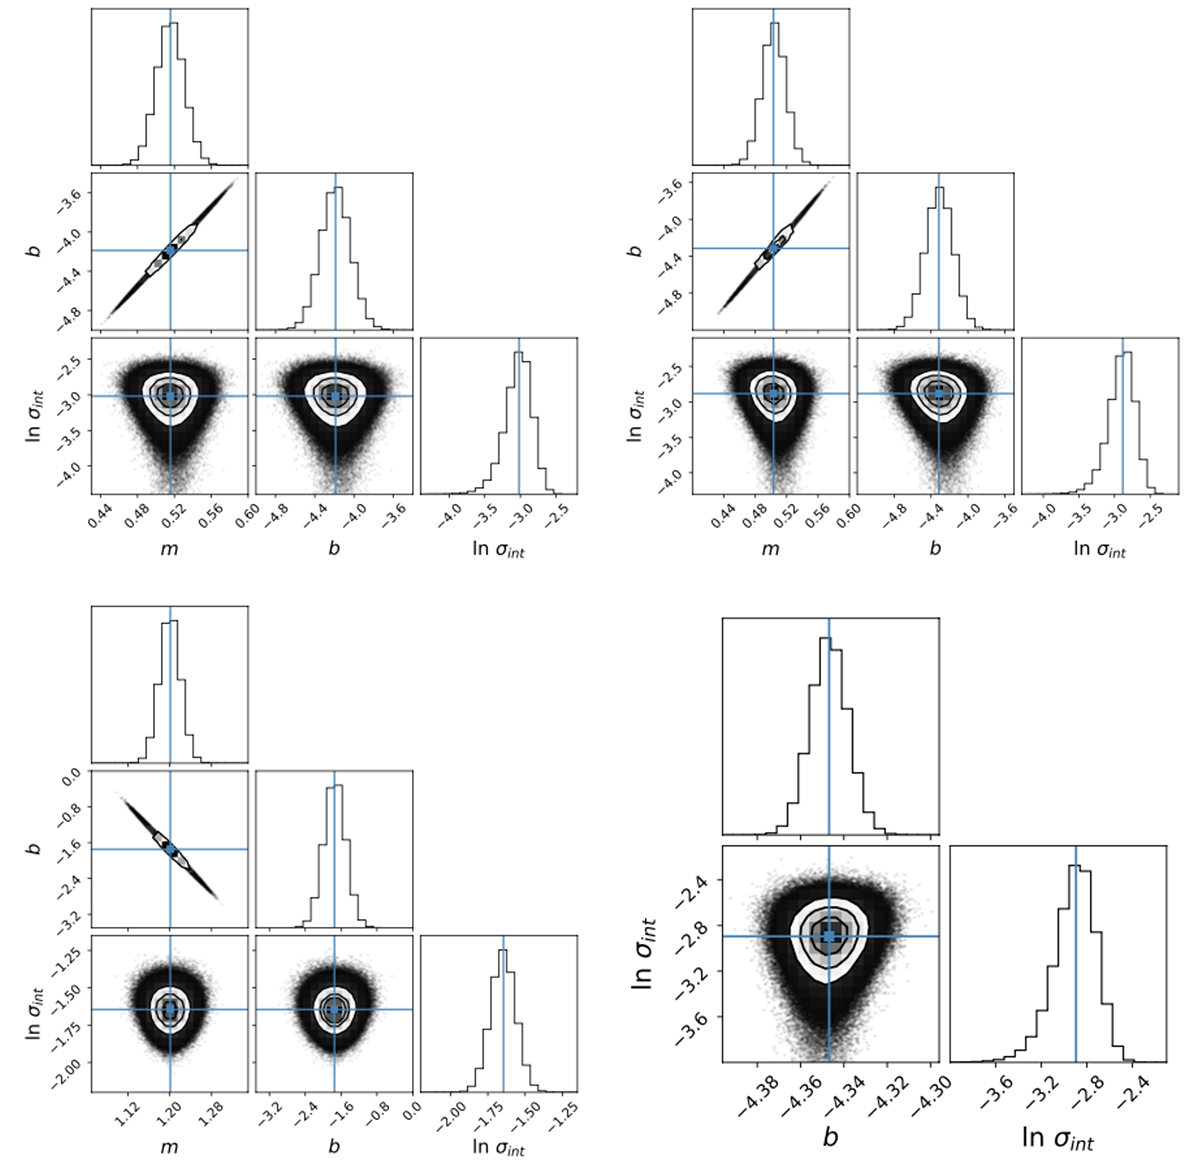
Fig. D.1.
Download original image
MCMC method in 70 BCGs and 64 CLASH cluster data. Upper right panel: Triangle diagrams of the regression parameters in the ODR MCMC method for the RAR, ![]() , with marginalized one-dimensional (histograms) and two-dimensional posterior distributions. The black contours represent 1σ and 2σ confidence regions. Upper left panel: Triangle diagrams of the regression parameters in the vertical MCMC method for the RAR,
, with marginalized one-dimensional (histograms) and two-dimensional posterior distributions. The black contours represent 1σ and 2σ confidence regions. Upper left panel: Triangle diagrams of the regression parameters in the vertical MCMC method for the RAR, ![]() . Lower right panel: Triangle diagrams of the regression parameters in the ODR MCMC method for the mass correlation,
. Lower right panel: Triangle diagrams of the regression parameters in the ODR MCMC method for the mass correlation, ![]() . Lower left panel: Triangle diagrams of the regression parameters in the ODR MCMC method for the RAR with a fixed slope, m = 0.5.
. Lower left panel: Triangle diagrams of the regression parameters in the ODR MCMC method for the RAR with a fixed slope, m = 0.5.
Current usage metrics show cumulative count of Article Views (full-text article views including HTML views, PDF and ePub downloads, according to the available data) and Abstracts Views on Vision4Press platform.
Data correspond to usage on the plateform after 2015. The current usage metrics is available 48-96 hours after online publication and is updated daily on week days.
Initial download of the metrics may take a while.