Fig. B.1.
Download original image
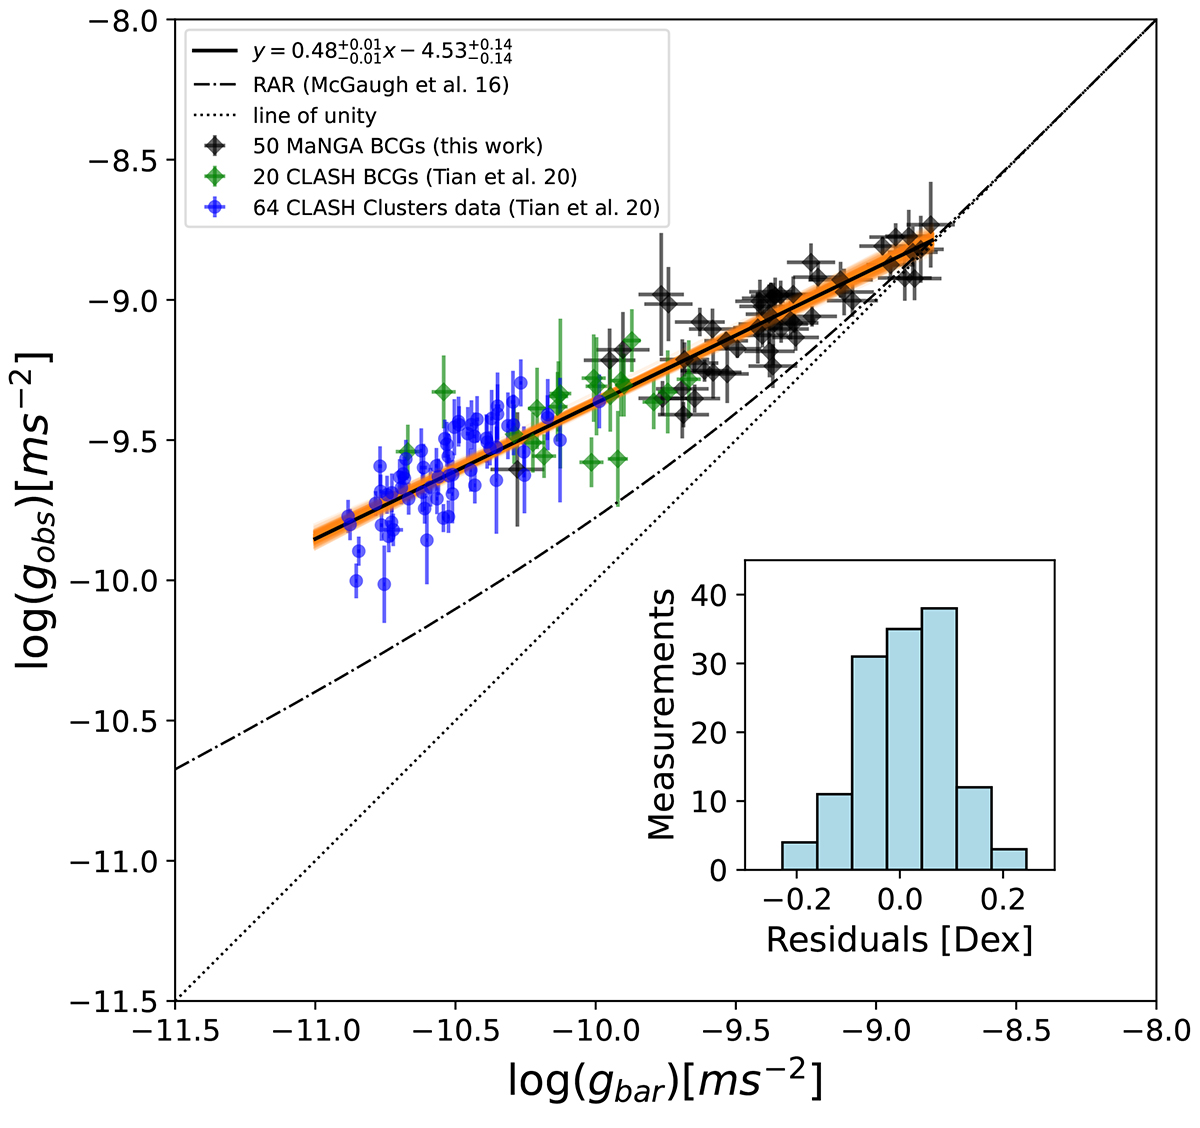
RAR of both BCGs and clusters when considering the mass-to-light ratio gradient for 50 MaNGA BCGs. All the symbols are the same as those in Fig. 2. The solid black line illustrates the resulting RAR of all samples: ![]() . For comparison, the galactic RAR is depicted by the dash-dotted line, while the dotted line represents the line of unity.
. For comparison, the galactic RAR is depicted by the dash-dotted line, while the dotted line represents the line of unity.
Current usage metrics show cumulative count of Article Views (full-text article views including HTML views, PDF and ePub downloads, according to the available data) and Abstracts Views on Vision4Press platform.
Data correspond to usage on the plateform after 2015. The current usage metrics is available 48-96 hours after online publication and is updated daily on week days.
Initial download of the metrics may take a while.