Fig. 4.
Download original image
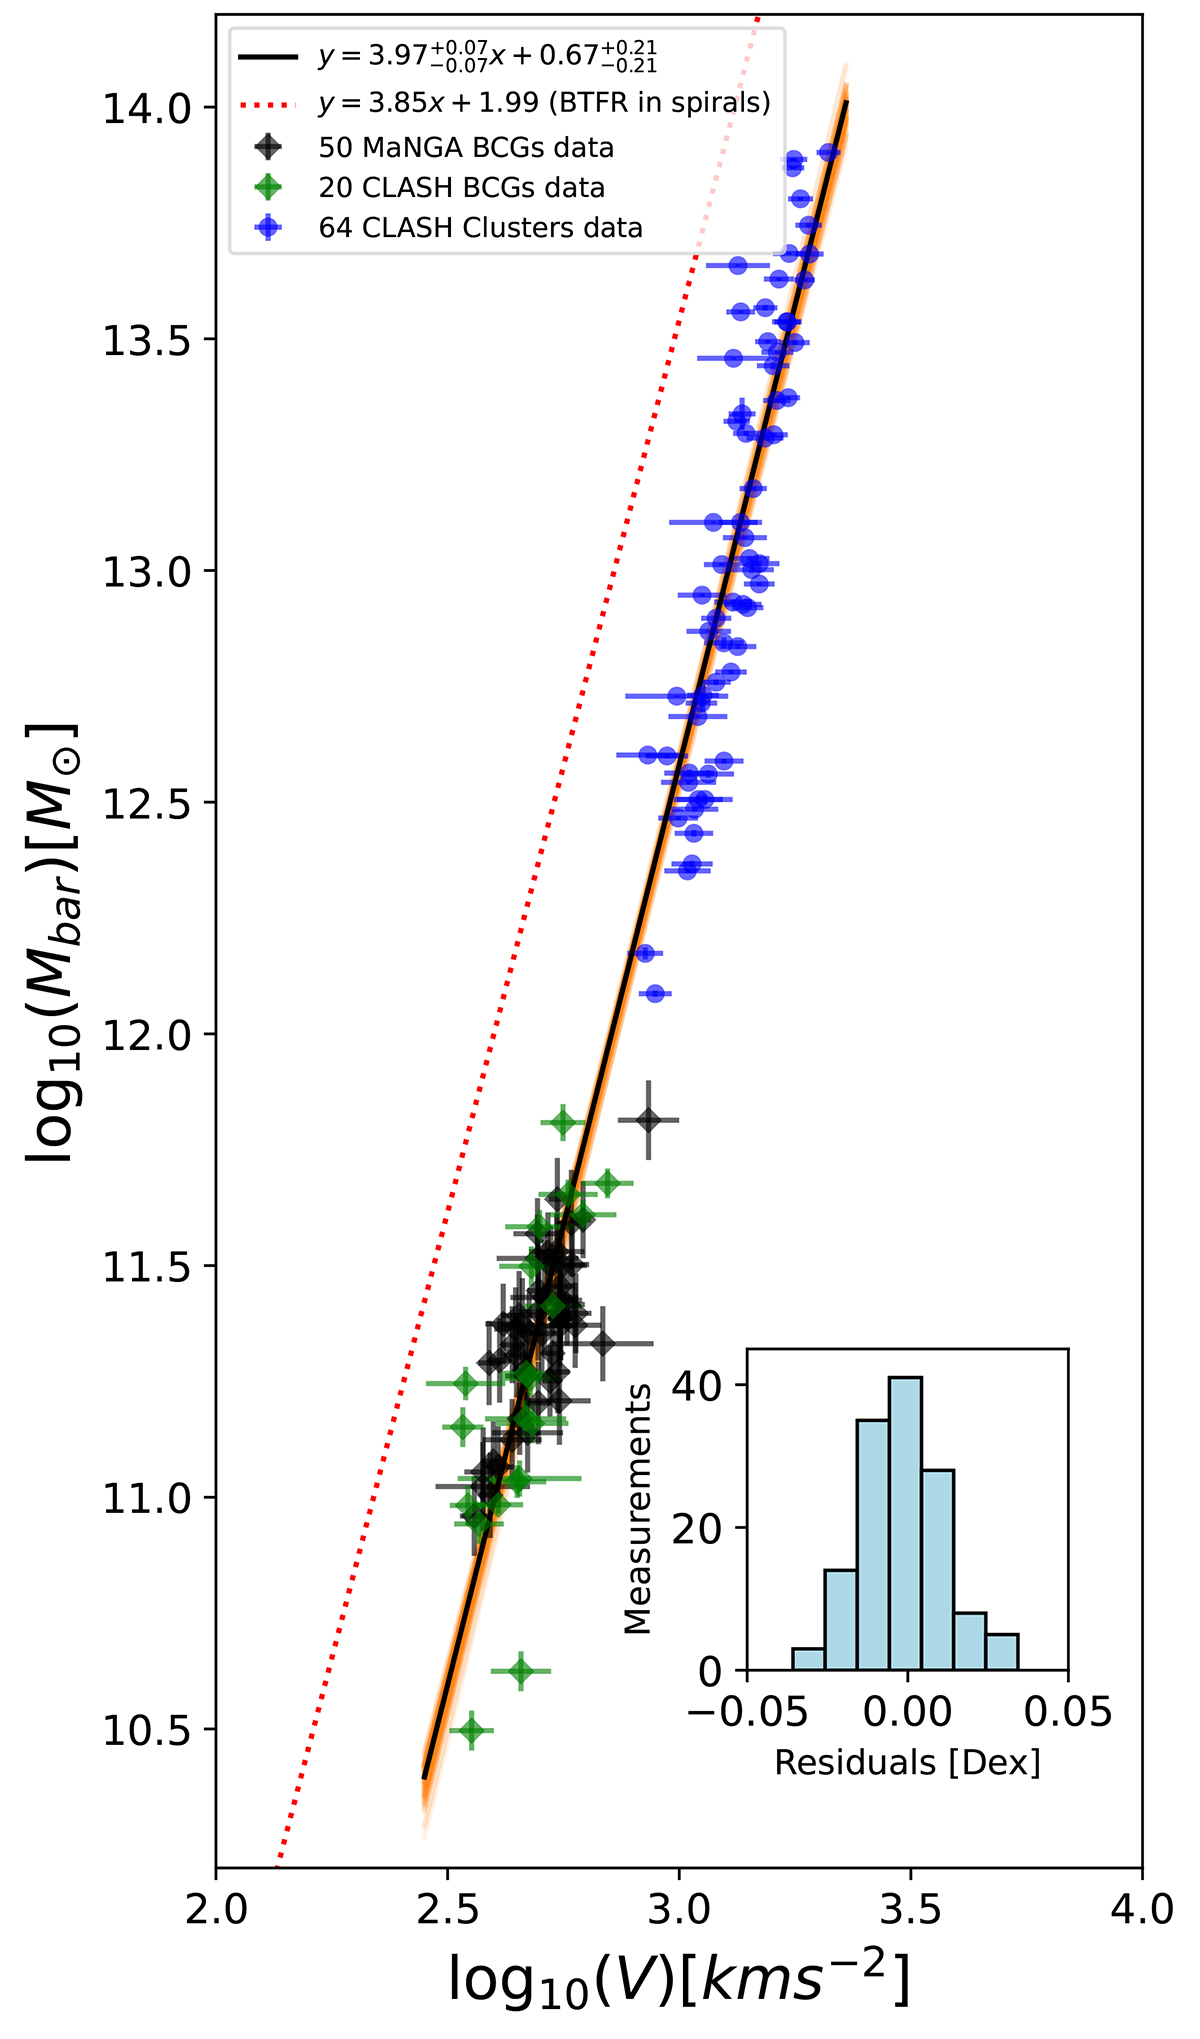
BTFR analysis with ODR MCMC for extended dynamic range. The solid black line illustrates the fitting BTFR of all samples: log(Mbar/M⊙) = (3.97 ± 0.07)log(V/m s−1)−(0.67 ± 0.21). The shaded orange area illustrates the 1σ error of the best fit with the ODR MCMC method. The inset panel demonstrates the histograms of the orthogonal residuals of a whole sample (blue). For comparison, the galactic BTFR (Lelli et al. 2019) is depicted by the dotted red line. The plot displays the residuals for 50 MaNGA BCGs (black diamonds), 20 CLASH BCGs (green diamonds), and 64 data points from CLASH clusters (blue circles).
Current usage metrics show cumulative count of Article Views (full-text article views including HTML views, PDF and ePub downloads, according to the available data) and Abstracts Views on Vision4Press platform.
Data correspond to usage on the plateform after 2015. The current usage metrics is available 48-96 hours after online publication and is updated daily on week days.
Initial download of the metrics may take a while.