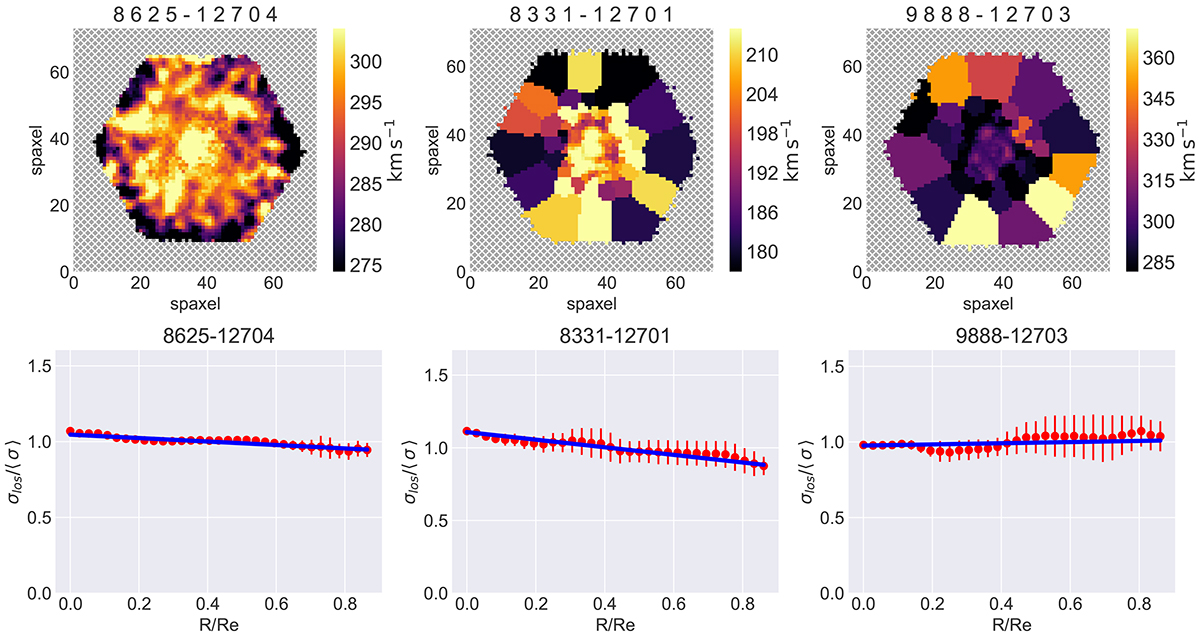
Fig. 1.
Download original image
Three examples of MaNGA BCGs with the plateifu of 8554-6102, 8331-12701, and 9888-12703. Upper panel: two-dimensional map plot of Spaxel data for the stellar velocity dispersion. Lower panel: velocity dispersion profiles in terms of the effective radius. The red circles represent the LOS velocity dispersion of concentric circles at different radii with the corresponding error bar. The solid blue lines represent the linear fit with the ODR MLE method.
Current usage metrics show cumulative count of Article Views (full-text article views including HTML views, PDF and ePub downloads, according to the available data) and Abstracts Views on Vision4Press platform.
Data correspond to usage on the plateform after 2015. The current usage metrics is available 48-96 hours after online publication and is updated daily on week days.
Initial download of the metrics may take a while.