Open Access
Fig. E.2.
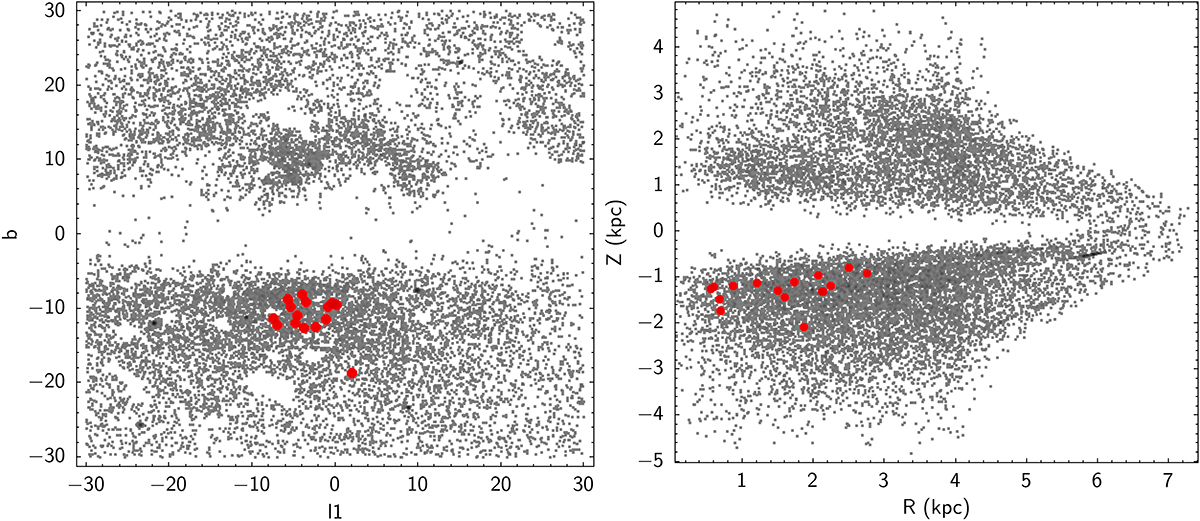
Download original image
Stars with [M/H]< − 1.5 from the sample of Rix et al. (2022) (grey dots) compared with the SpiteF stars of our stars in the planes (l1, b) and (R, Z). To be consistent with figure 3 of Rix et al. (2022), in the left panel we plot l1 = {lifl ≤ 180.;l − 360. ifl > 180}.
Current usage metrics show cumulative count of Article Views (full-text article views including HTML views, PDF and ePub downloads, according to the available data) and Abstracts Views on Vision4Press platform.
Data correspond to usage on the plateform after 2015. The current usage metrics is available 48-96 hours after online publication and is updated daily on week days.
Initial download of the metrics may take a while.