Open Access
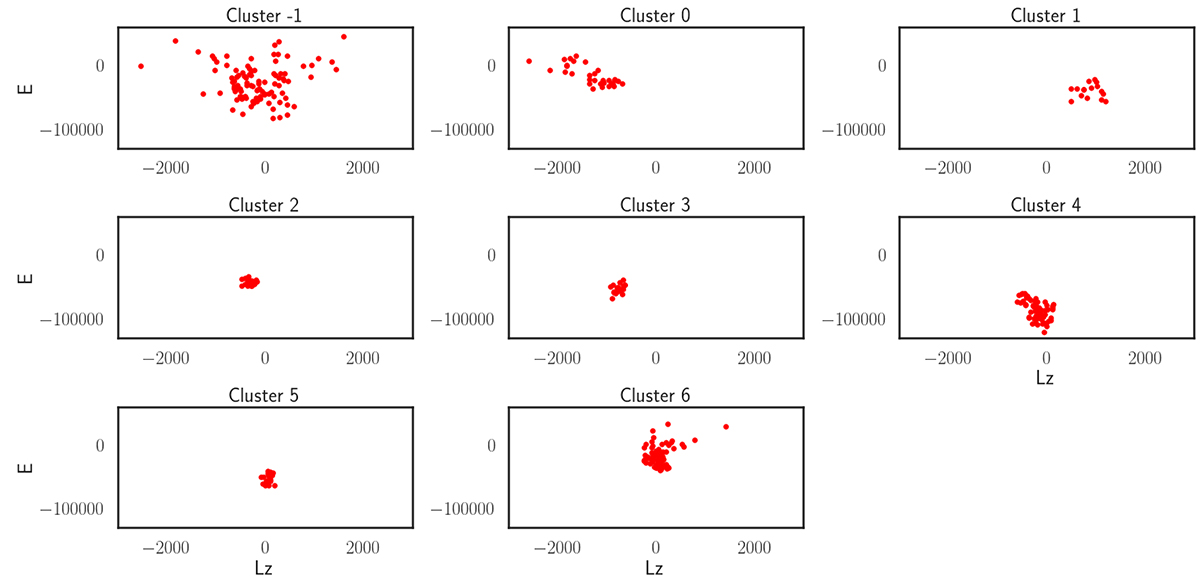
Fig. D.4.
Download original image
E vs. LZ plane. On each panel we plot stars belonging to one of the 7 clusters (the top label indicates the number of the cluster from 0 to 6) identified using HDBSCAN using the t-SNE projection of the input parameters. Unclustered stars (top-left panel) are labelled ‘Cluster -1’.
Current usage metrics show cumulative count of Article Views (full-text article views including HTML views, PDF and ePub downloads, according to the available data) and Abstracts Views on Vision4Press platform.
Data correspond to usage on the plateform after 2015. The current usage metrics is available 48-96 hours after online publication and is updated daily on week days.
Initial download of the metrics may take a while.