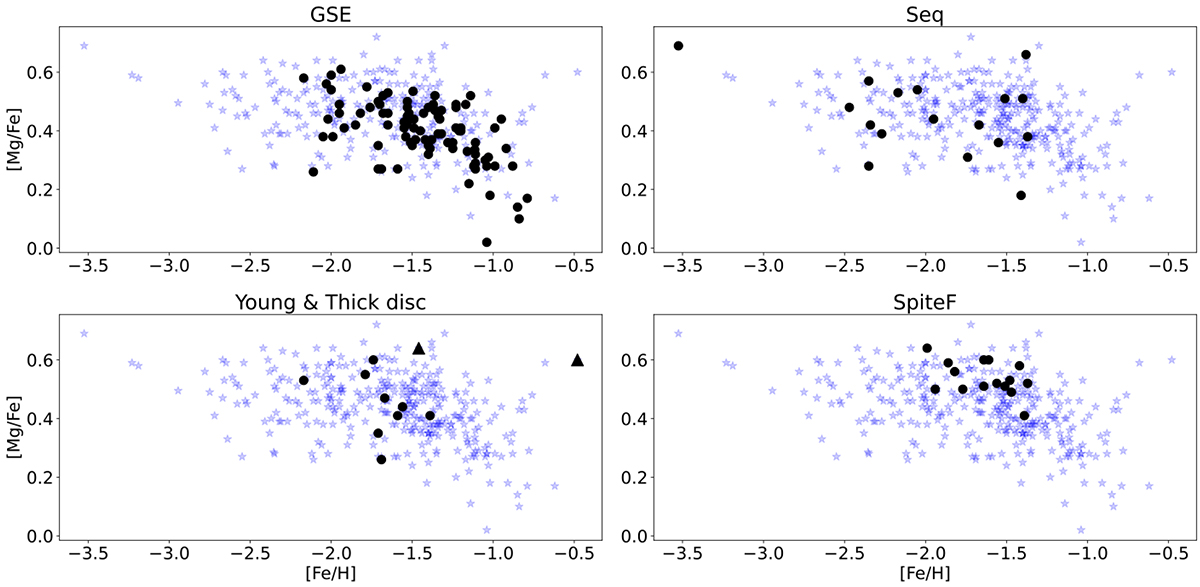
Fig. 17.
Download original image
[Mg/Fe] vs. [Fe/H] for the programme stars. In the various planes specific groups (filled black circles and black triangles) are plotted on top of all stars (cyan stars). Top panels: GSE (left) and Seq (right) candidates. Bottom panels: young (filled circles) and thick disc stars (filled triangles, left panel) and bulge (right).
Current usage metrics show cumulative count of Article Views (full-text article views including HTML views, PDF and ePub downloads, according to the available data) and Abstracts Views on Vision4Press platform.
Data correspond to usage on the plateform after 2015. The current usage metrics is available 48-96 hours after online publication and is updated daily on week days.
Initial download of the metrics may take a while.