Fig. 4
Download original image
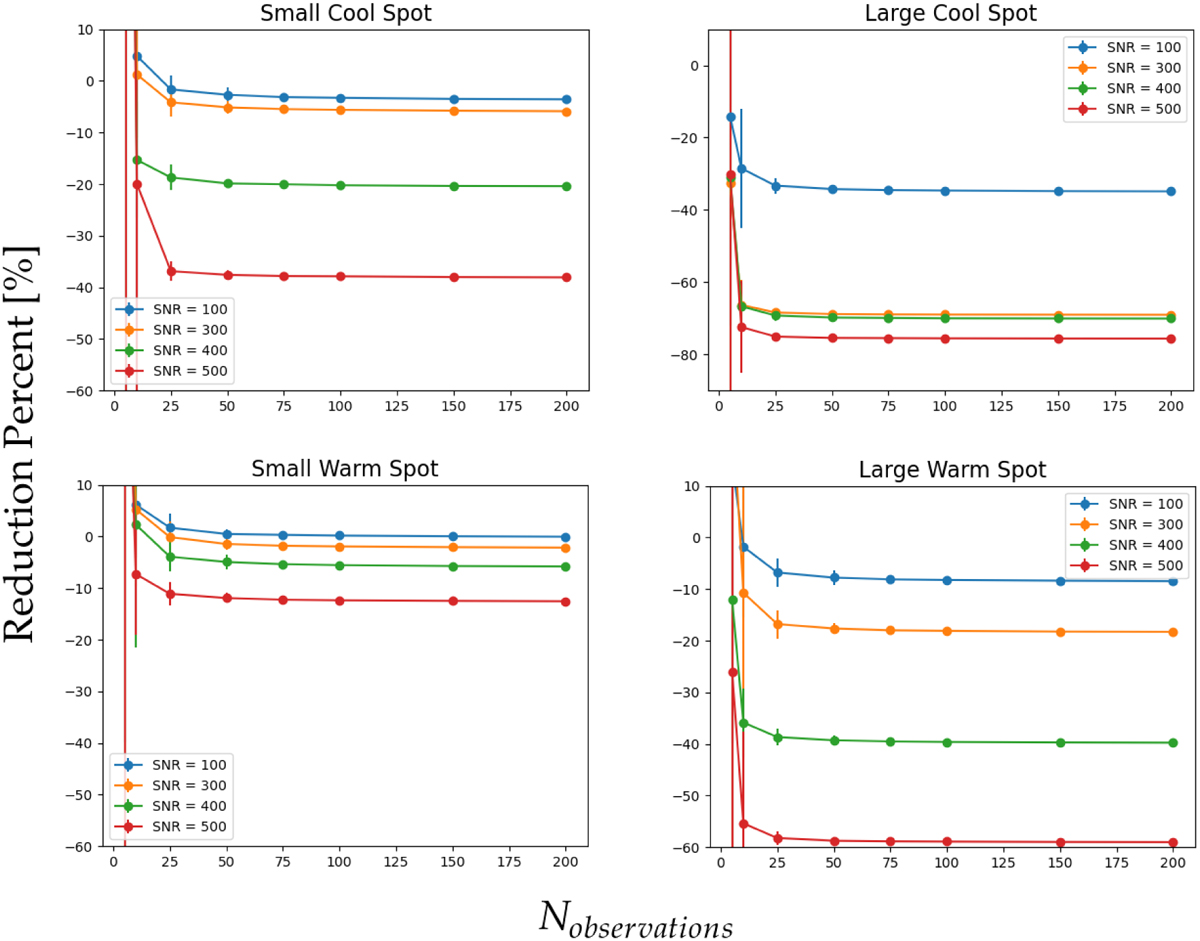
Comparing the reduction in starspot RV noise for various spot sizes and temperatures. This is done across S/Ns of 100, 300, 400, and 500. An additional S/N of 1000 is used for the small warm spot as the lower-quality simulations do not reduce the RV signal significantly. It is important to note that a negative RV reduction here signifies a decrease in RV jitter, whereas a positive RV reduction signifies an increase in RV jitter.
Current usage metrics show cumulative count of Article Views (full-text article views including HTML views, PDF and ePub downloads, according to the available data) and Abstracts Views on Vision4Press platform.
Data correspond to usage on the plateform after 2015. The current usage metrics is available 48-96 hours after online publication and is updated daily on week days.
Initial download of the metrics may take a while.