Fig. 7
Download original image
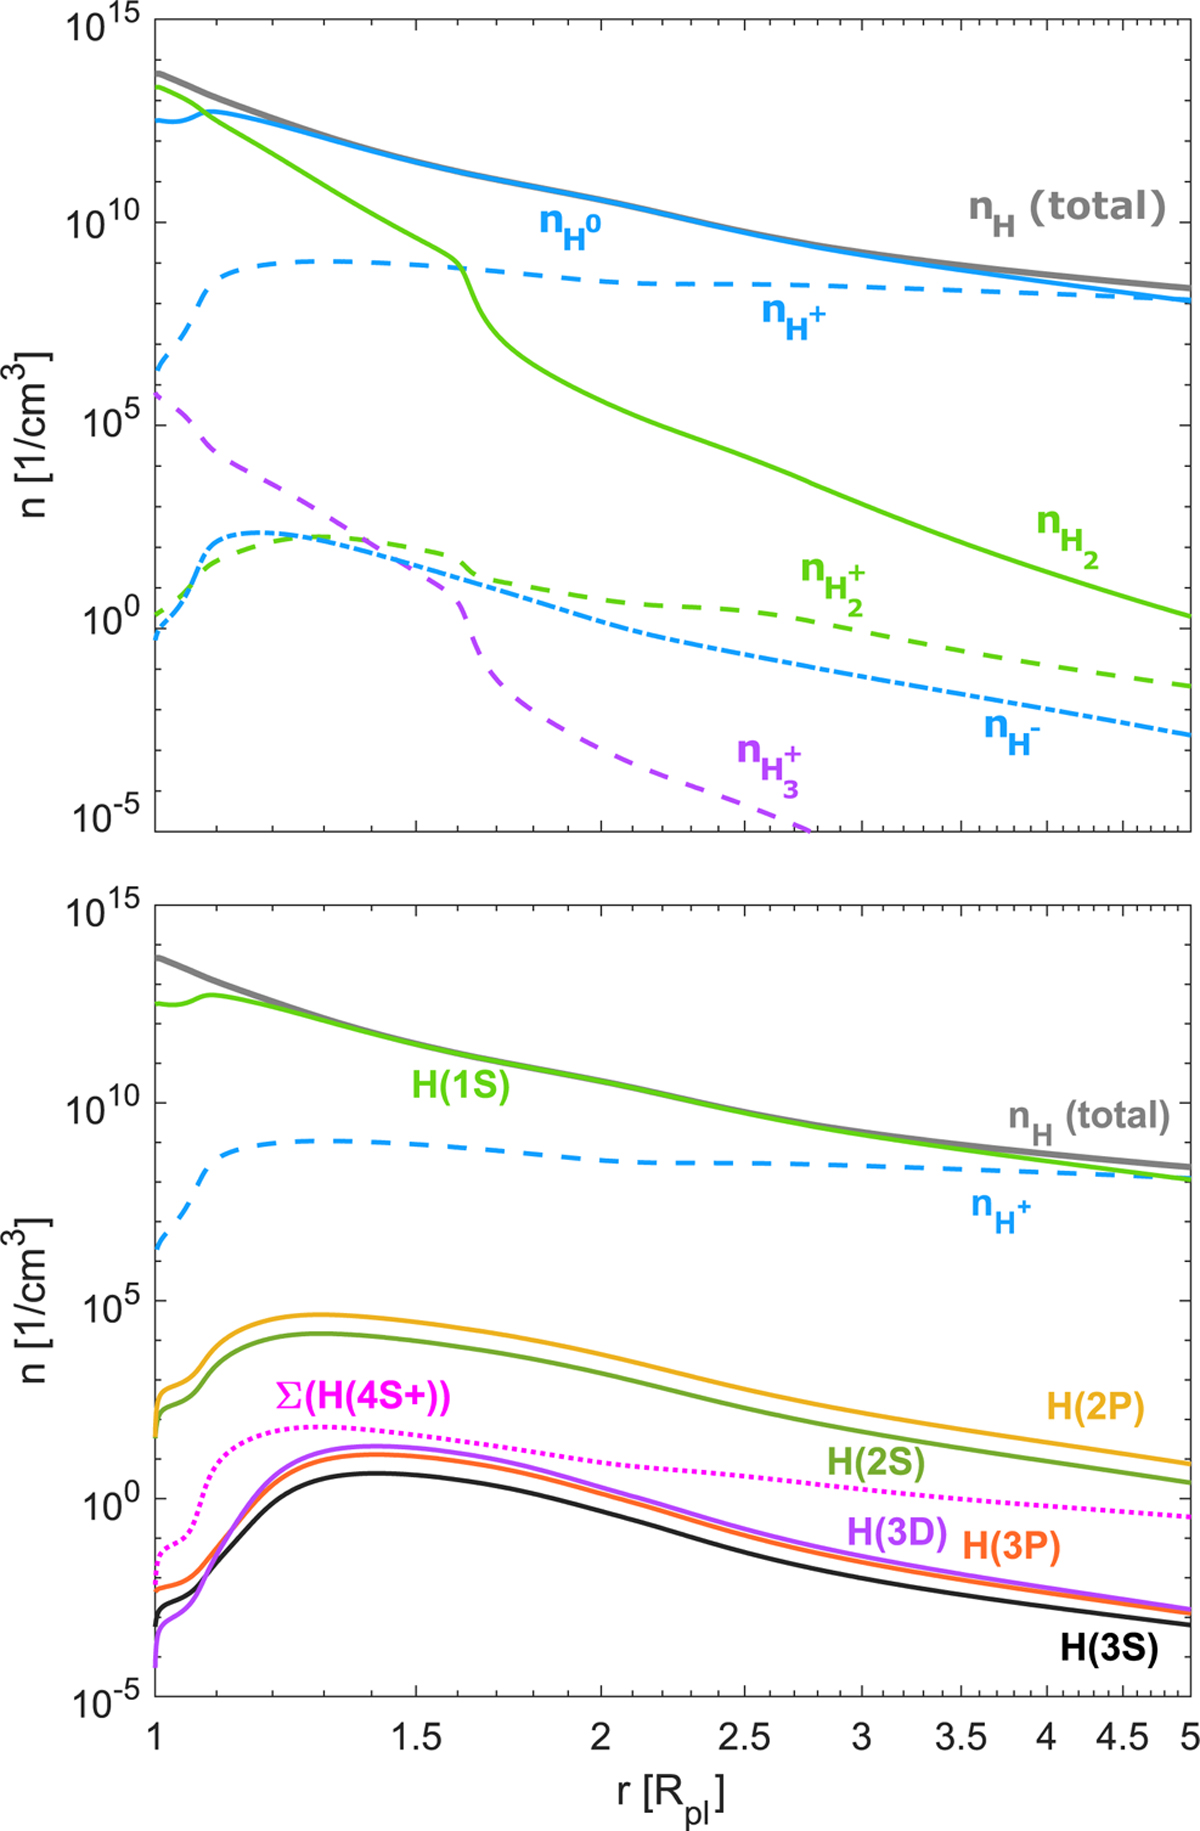
Distribution of hydrogen species against radial distance predicted by model#l. Top panel: numerical densities of neutral atomic hydrogen (blue solid line) and its ions (blue dashed), and H− (blue dash-dotted), molecular hydrogen (green solid) and its ions (green dashed), and ![]() (violet dashed). Bottom panel: distribution of neutral atomic hydrogen in terms of excitation levels, i.e. numerical densities of hydrogen in 1S (light green solid line), 2S (dark green solid), 2P (dark yellow solid), 3S (black solid), 3P (orange solid), and 3D (violet solid) states. The dotted magenta line gives the summed numerical densities of hydrogen atoms in the energy levels 4S and higher. In both panels, the grey solid line gives the total density of all hydrogen species for reference.
(violet dashed). Bottom panel: distribution of neutral atomic hydrogen in terms of excitation levels, i.e. numerical densities of hydrogen in 1S (light green solid line), 2S (dark green solid), 2P (dark yellow solid), 3S (black solid), 3P (orange solid), and 3D (violet solid) states. The dotted magenta line gives the summed numerical densities of hydrogen atoms in the energy levels 4S and higher. In both panels, the grey solid line gives the total density of all hydrogen species for reference.
Current usage metrics show cumulative count of Article Views (full-text article views including HTML views, PDF and ePub downloads, according to the available data) and Abstracts Views on Vision4Press platform.
Data correspond to usage on the plateform after 2015. The current usage metrics is available 48-96 hours after online publication and is updated daily on week days.
Initial download of the metrics may take a while.