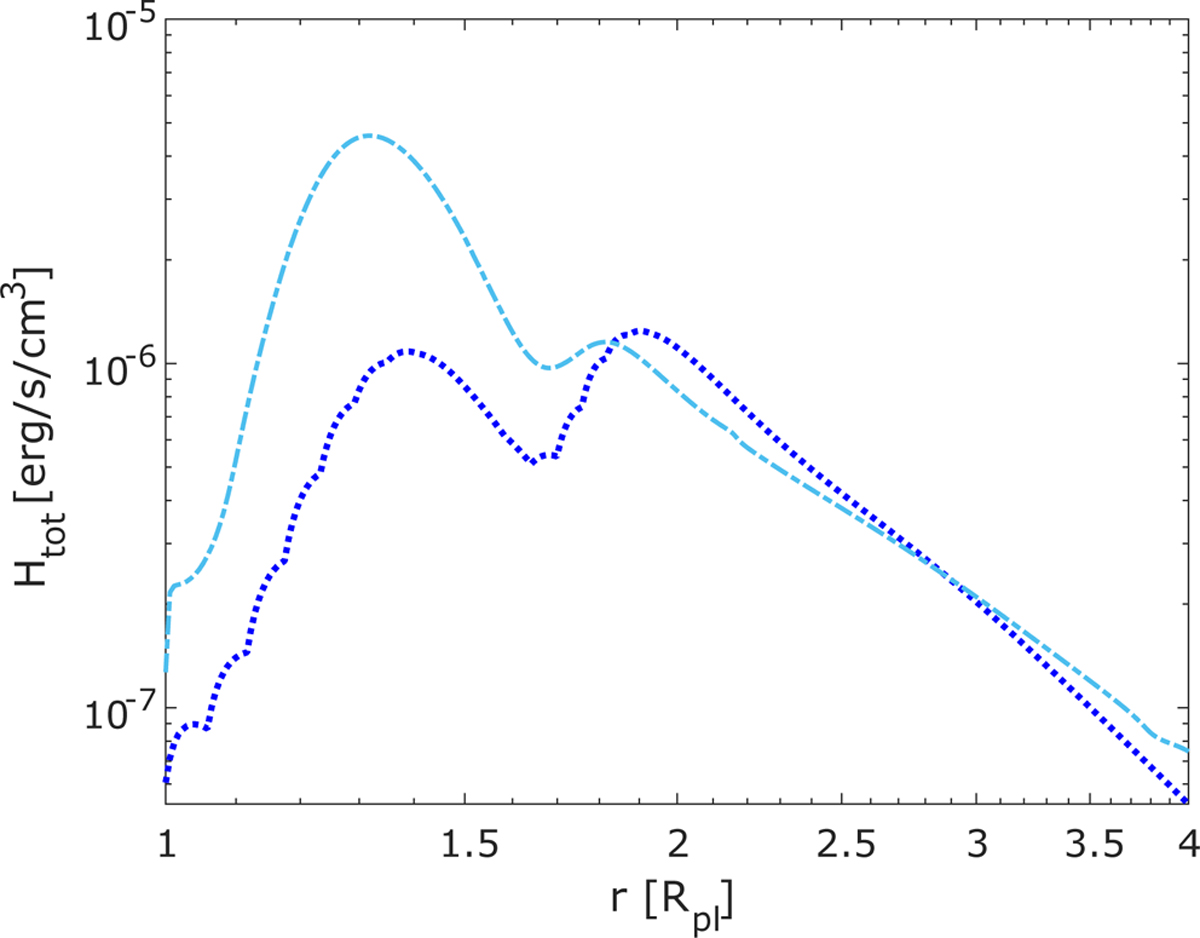
Fig. 6
Download original image
Volume heating rate predicted by the basic hydrodynamic model #0 (dark blue dotted line) compared to the volume heating rate calculated considering Cloudy for the same density and temperature profiles (light blue dash-dotted line), not accounting for wind advection. These profiles result following the first instance in which Cloudy is run in the code.
Current usage metrics show cumulative count of Article Views (full-text article views including HTML views, PDF and ePub downloads, according to the available data) and Abstracts Views on Vision4Press platform.
Data correspond to usage on the plateform after 2015. The current usage metrics is available 48-96 hours after online publication and is updated daily on week days.
Initial download of the metrics may take a while.