Fig. 5
Download original image
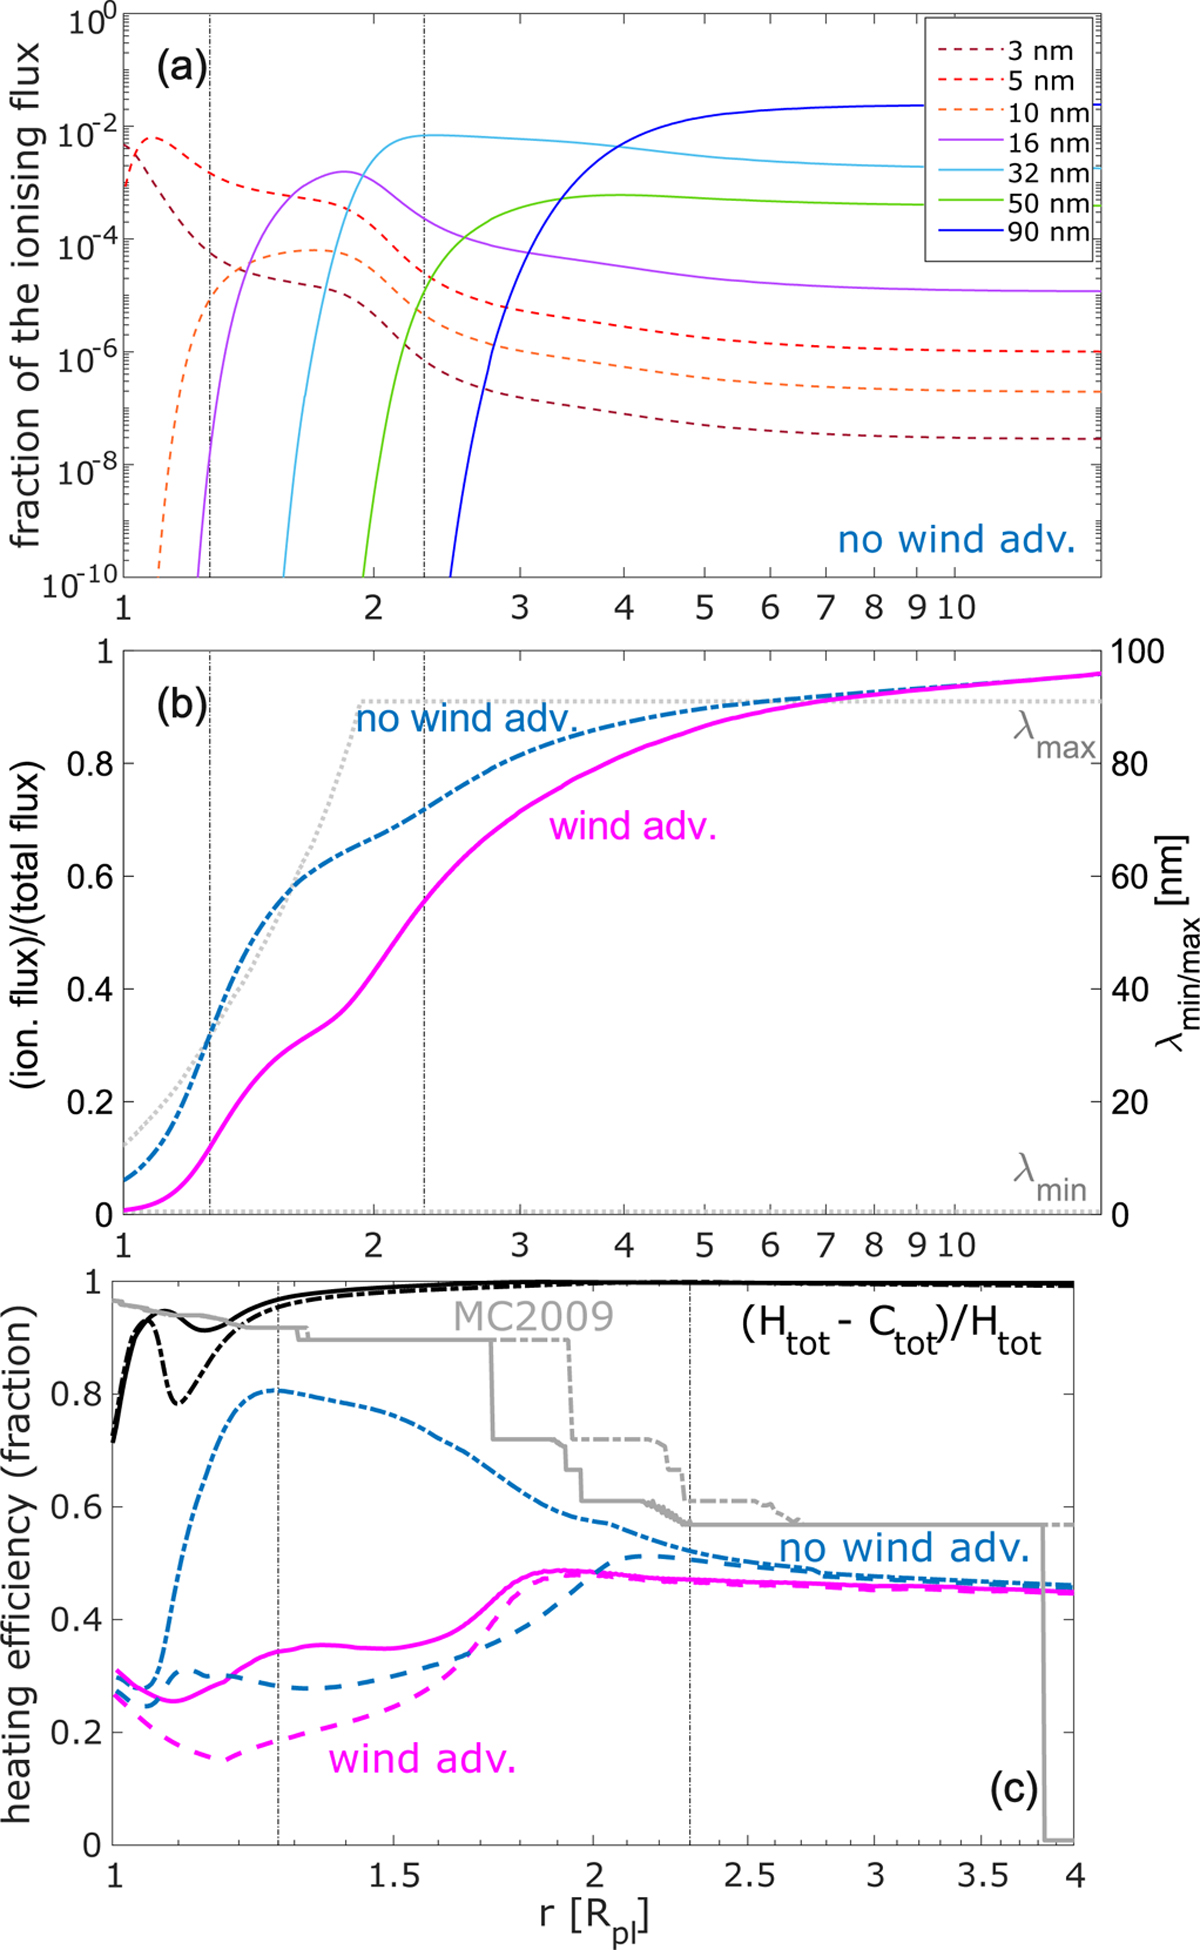
Details of the heating profiles obtained from models #1 and #2 for the hot sub-Neptune 4.2B. Panel a: fraction of total photoionisation rate corresponding to the specific irradiation wavelengths as a function of radial distance. The dashed lines are for wavelengths in the X-ray band, while the solid lines are for wavelengths in the EUV band (see legend). Panel b: fraction of absorbed stellar flux (blue and magenta lines corresponding to model #1 and model #2, respectively; left y-axis) and total span of absorbed wavelengths at each given radial distance (grey dotted lines; right y-axis). Panel c: heating efficiency following the last Cloudy iteration of model #1 (blue dash-dotted line), and the last Cloudy iteration of model #2 (magenta solid line). The dashed lines in corresponding colours show the inputs from photoionisation heating only in models #1 and #2. The two black lines at the top show the relative cooling input for model #1 (dash-dotted line) and model #2 (solid line). The grey solid (model#2) and dash-dotted (model#1) lines show for comparison the heating efficiency given by the approximation of Murray-Clay et al. (2009) for the wavelengths that provide the largest input at the given radial distance. In each panel, the two vertical lines give the position of the two maxima of the volume heating rate.
Current usage metrics show cumulative count of Article Views (full-text article views including HTML views, PDF and ePub downloads, according to the available data) and Abstracts Views on Vision4Press platform.
Data correspond to usage on the plateform after 2015. The current usage metrics is available 48-96 hours after online publication and is updated daily on week days.
Initial download of the metrics may take a while.