Fig. C.1
Download original image
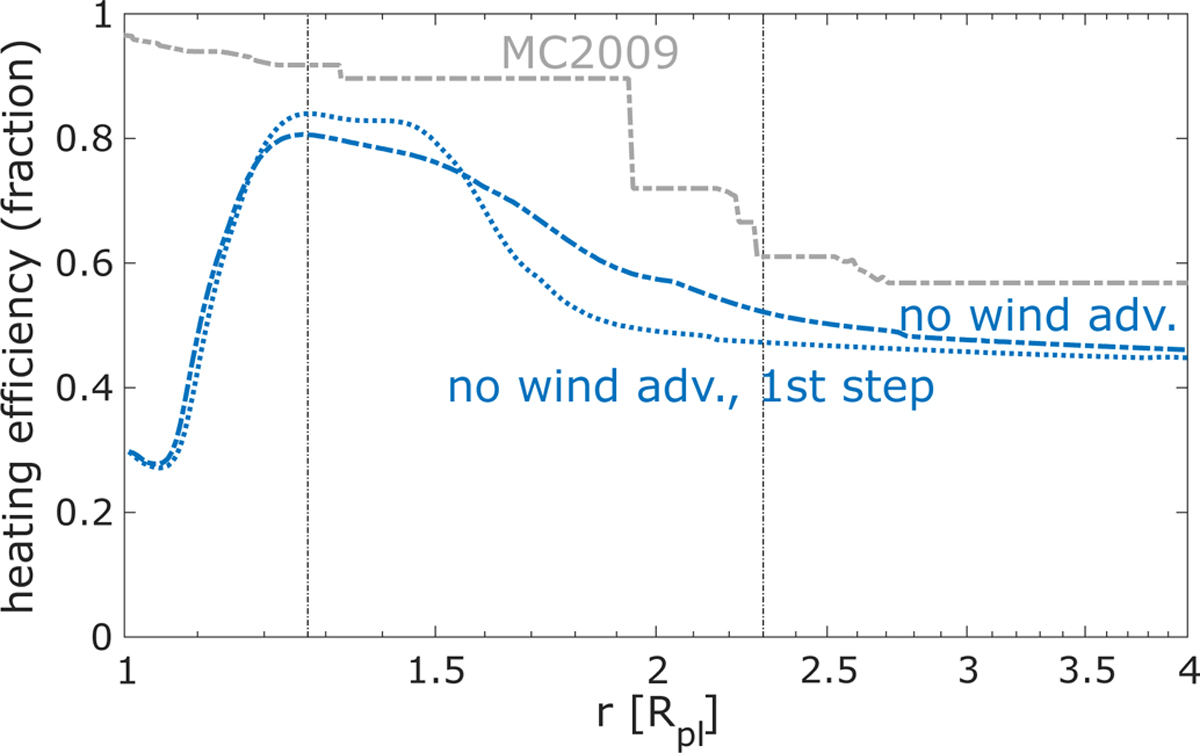
Heating efficiency calculated at the first Cloudy iteration in model #1 (blue dotted line) and the last Cloudy iteration of model #1 (blue dash-dotted line). The grey dash-dotted line denotes the maximum heating efficiency calculated using the approximation from Murray-Clay et al. (2009), while the two vertical lines give the positions of the maxima of the heating function.
Current usage metrics show cumulative count of Article Views (full-text article views including HTML views, PDF and ePub downloads, according to the available data) and Abstracts Views on Vision4Press platform.
Data correspond to usage on the plateform after 2015. The current usage metrics is available 48-96 hours after online publication and is updated daily on week days.
Initial download of the metrics may take a while.