Fig. 11
Download original image
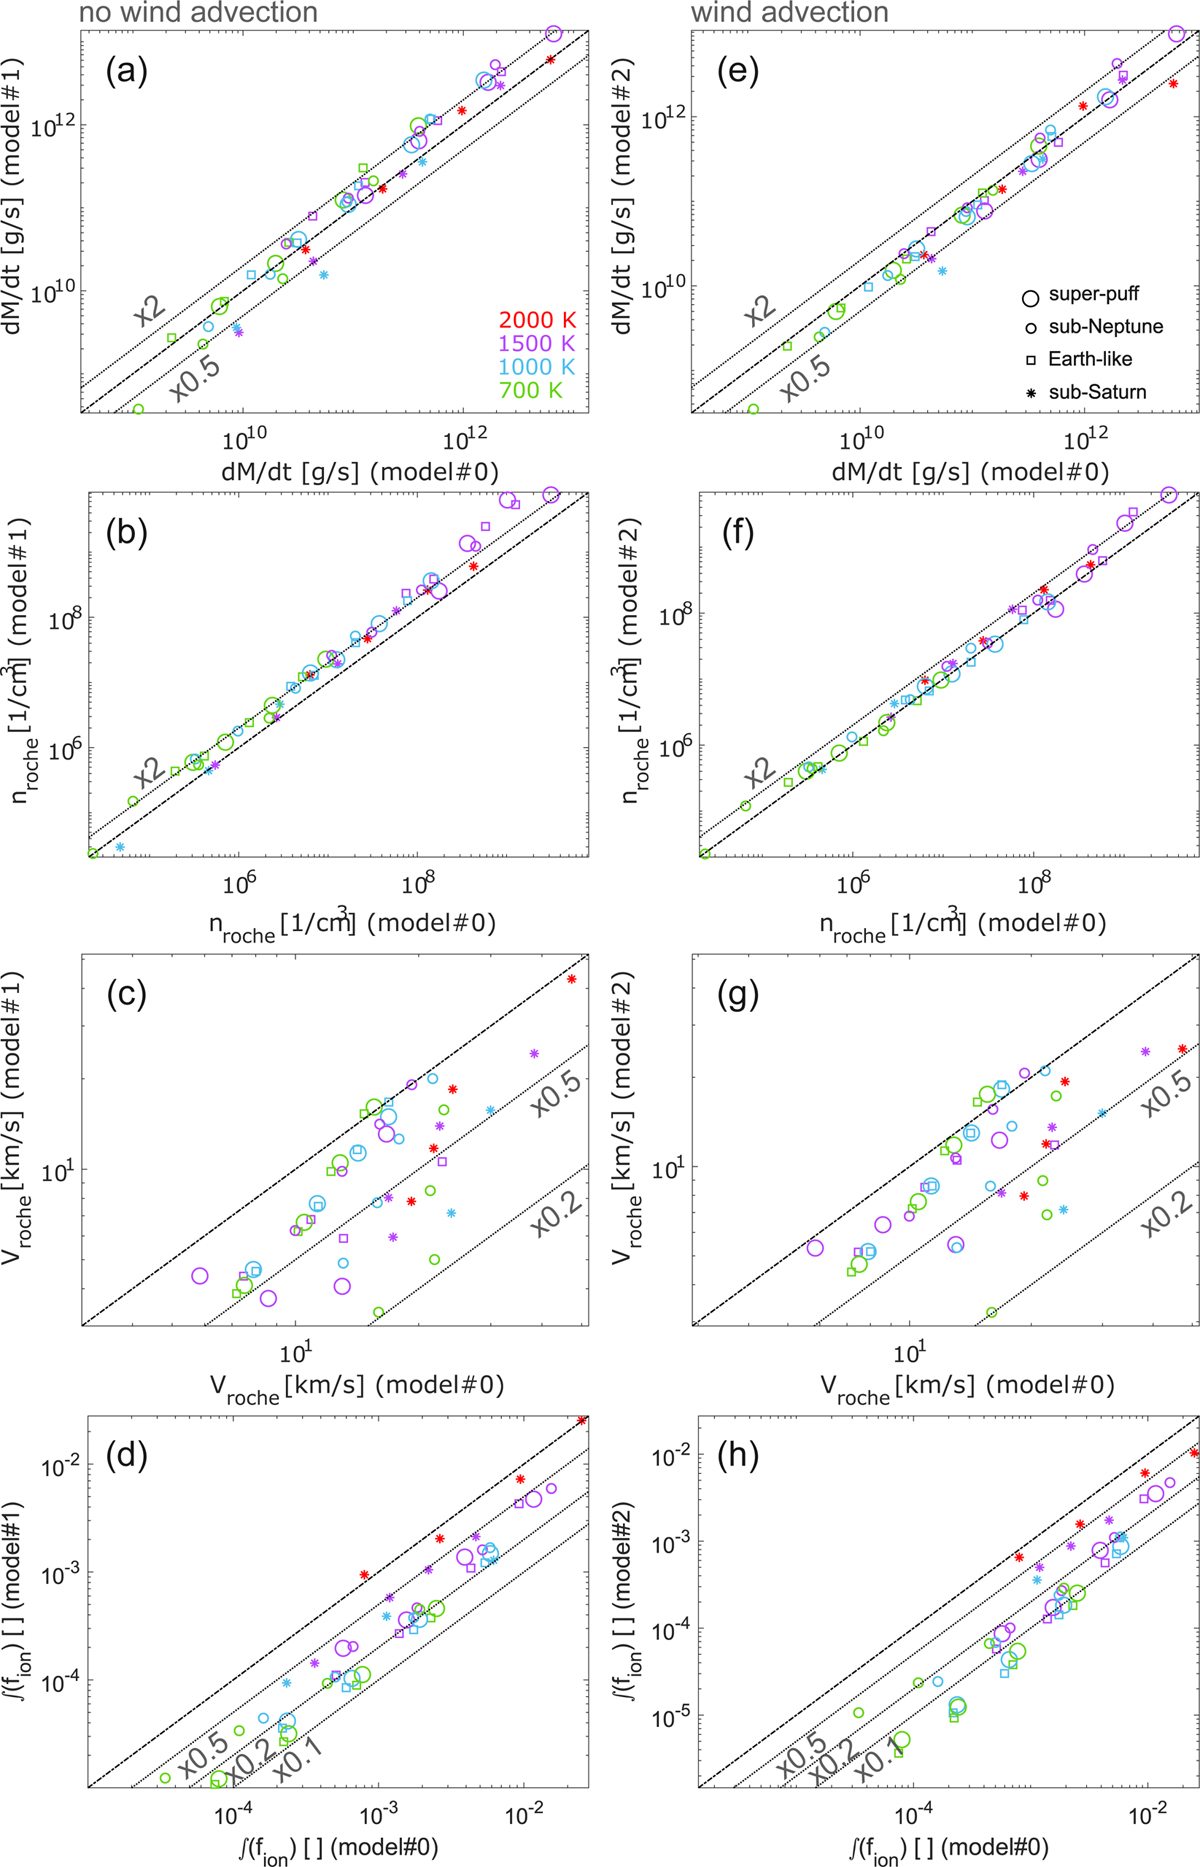
Comparison of the basic parameters of the atmospheric outflow between models #0 and #1 (panels a-d) and models #0 and #2 (panels e–h). Specifically, the atmospheric mass-loss rate (panels a and e), the outflow density at Rroche (panels b and f), the outflow velocity at Rroche (panels c and g), and the total fraction of ions below Rroche (panels d and h) are compared. In each panel the x-axis corresponds to the value of the specific parameter predicted by model #0 and the y-axis corresponds to the same parameter predicted by model #1 (panels a–d) or model #2 (panels e–h). The different colours correspond to the different equilibrium temperatures and the different symbols correspond to the different planet types, as indicated in the legends in panels a and b. The black dash-dotted lines in each panel show the equality of the parameters predicted by the two models, and the additional grey lines show different ratios of the parameters P obtained from the different models in the form Pmodel#1/#2 = c × Pmodel#0, where the coefficient c is shown in the plots next to each grey line.
Current usage metrics show cumulative count of Article Views (full-text article views including HTML views, PDF and ePub downloads, according to the available data) and Abstracts Views on Vision4Press platform.
Data correspond to usage on the plateform after 2015. The current usage metrics is available 48-96 hours after online publication and is updated daily on week days.
Initial download of the metrics may take a while.