Fig. 8
Download original image
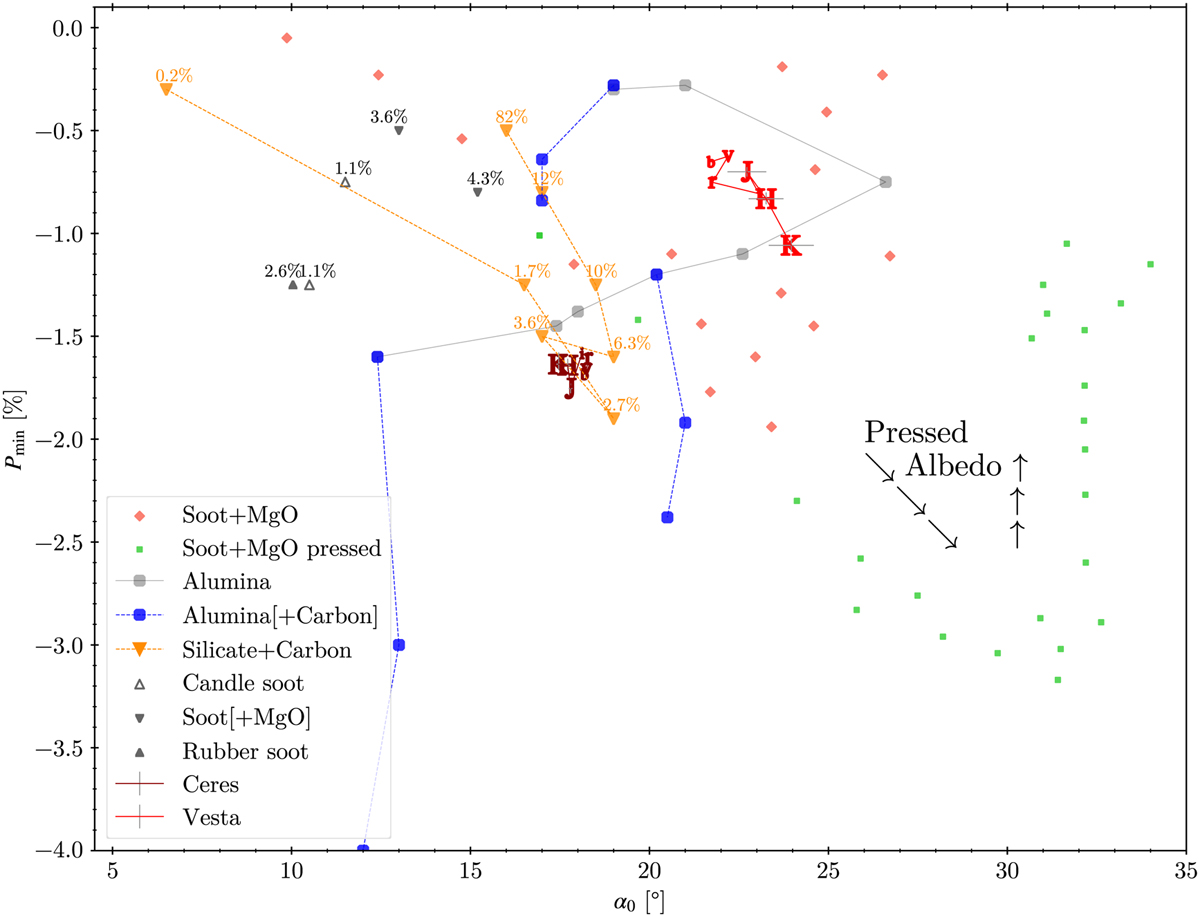
Laboratory samples in Pmin−α0 (depth-width of NPB) space. Alumina samples are shown in Fig. 1. The numbers with units % are albedo values. “Silicate+Carbon” samples are connected by lines in the order of albedo. The arrows for “Pressed Albedo” indicate the increasing albedo for the pressed MgO and soot mixture sample given in the original publication. Ceres and Vesta are shown for comparison (see Fig. 3; b=0.30–0.45 µm).
Current usage metrics show cumulative count of Article Views (full-text article views including HTML views, PDF and ePub downloads, according to the available data) and Abstracts Views on Vision4Press platform.
Data correspond to usage on the plateform after 2015. The current usage metrics is available 48-96 hours after online publication and is updated daily on week days.
Initial download of the metrics may take a while.