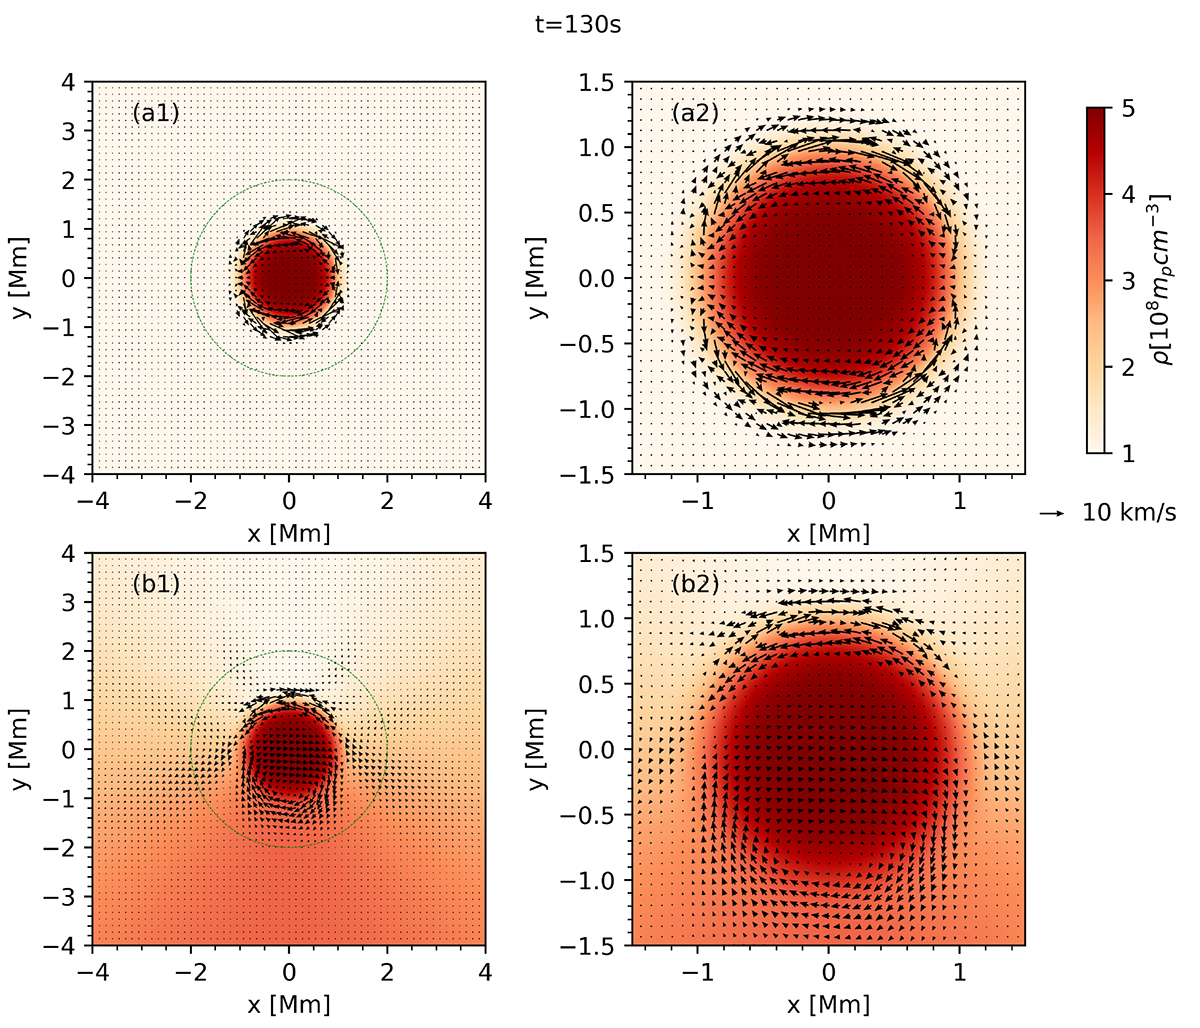
Fig. 3.
Download original image
Density distributions and velocity fields at the loop apex for the symmetric (top) and asymmetric (bottom) cases at t = 130 s. The dashed green lines mark a circle of radius r = 2 Mm. The right panels show zoomed-in views of the left ones. An animated version of this figure is available online; it has the same layout and runs from 0 to 400 s.
Current usage metrics show cumulative count of Article Views (full-text article views including HTML views, PDF and ePub downloads, according to the available data) and Abstracts Views on Vision4Press platform.
Data correspond to usage on the plateform after 2015. The current usage metrics is available 48-96 hours after online publication and is updated daily on week days.
Initial download of the metrics may take a while.