Fig. 7.
Download original image
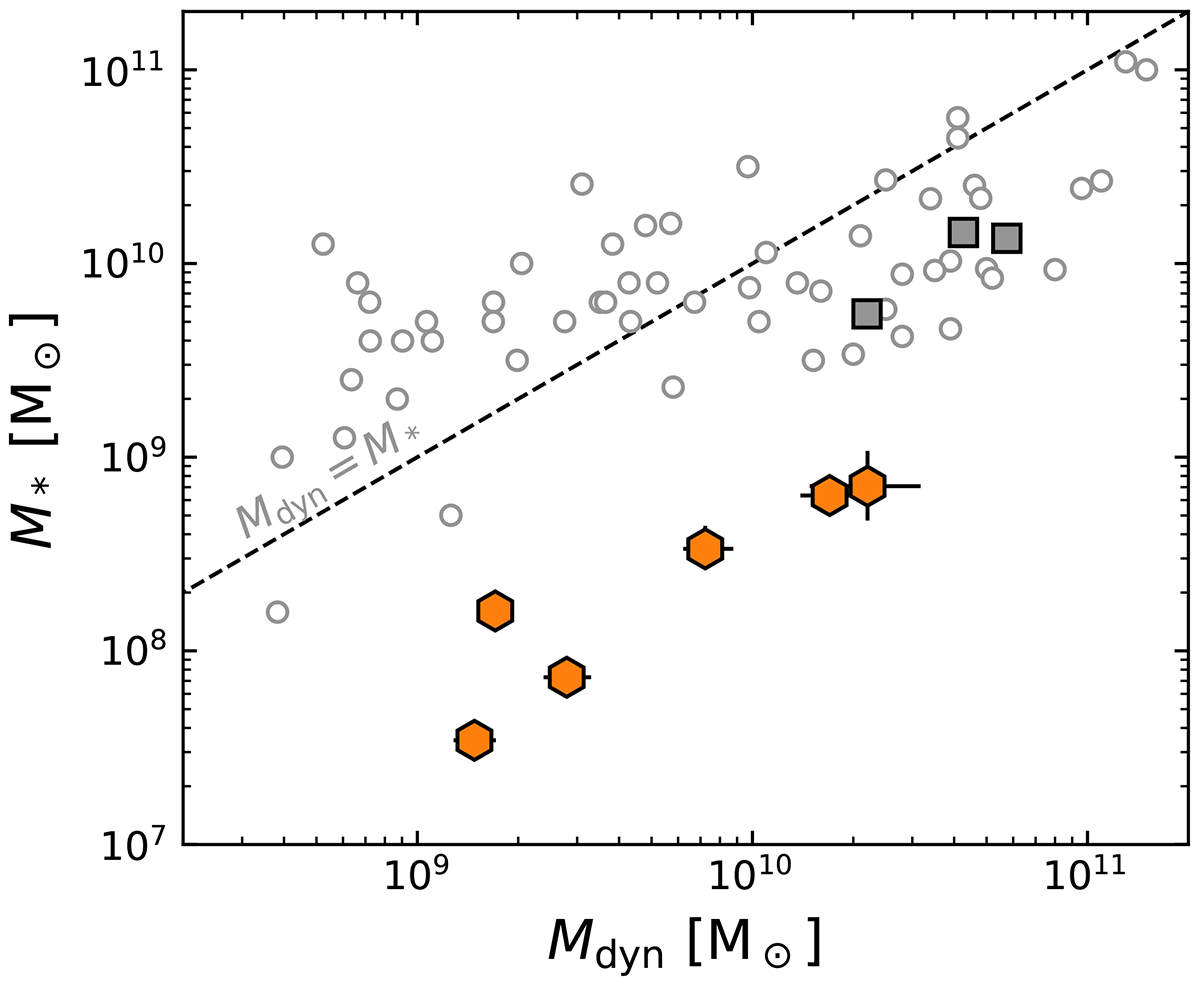
Stellar mass versus dynamical mass (Eq. (4)) as inferred from the prism and high-resolution spectroscopy, respectively. The dashed line shows the one-to-one relation between the two masses. The data points from the literature (circles, squares) are as described in Fig. 5. As is to be expected, the dynamical masses are higher than the stellar masses for all objects in our sample. Surprisingly, however, the dynamical masses are substantially higher (up to a factor of ∼40), most likely indicating high gas masses or large systematic uncertainties in the stellar mass estimates.
Current usage metrics show cumulative count of Article Views (full-text article views including HTML views, PDF and ePub downloads, according to the available data) and Abstracts Views on Vision4Press platform.
Data correspond to usage on the plateform after 2015. The current usage metrics is available 48-96 hours after online publication and is updated daily on week days.
Initial download of the metrics may take a while.