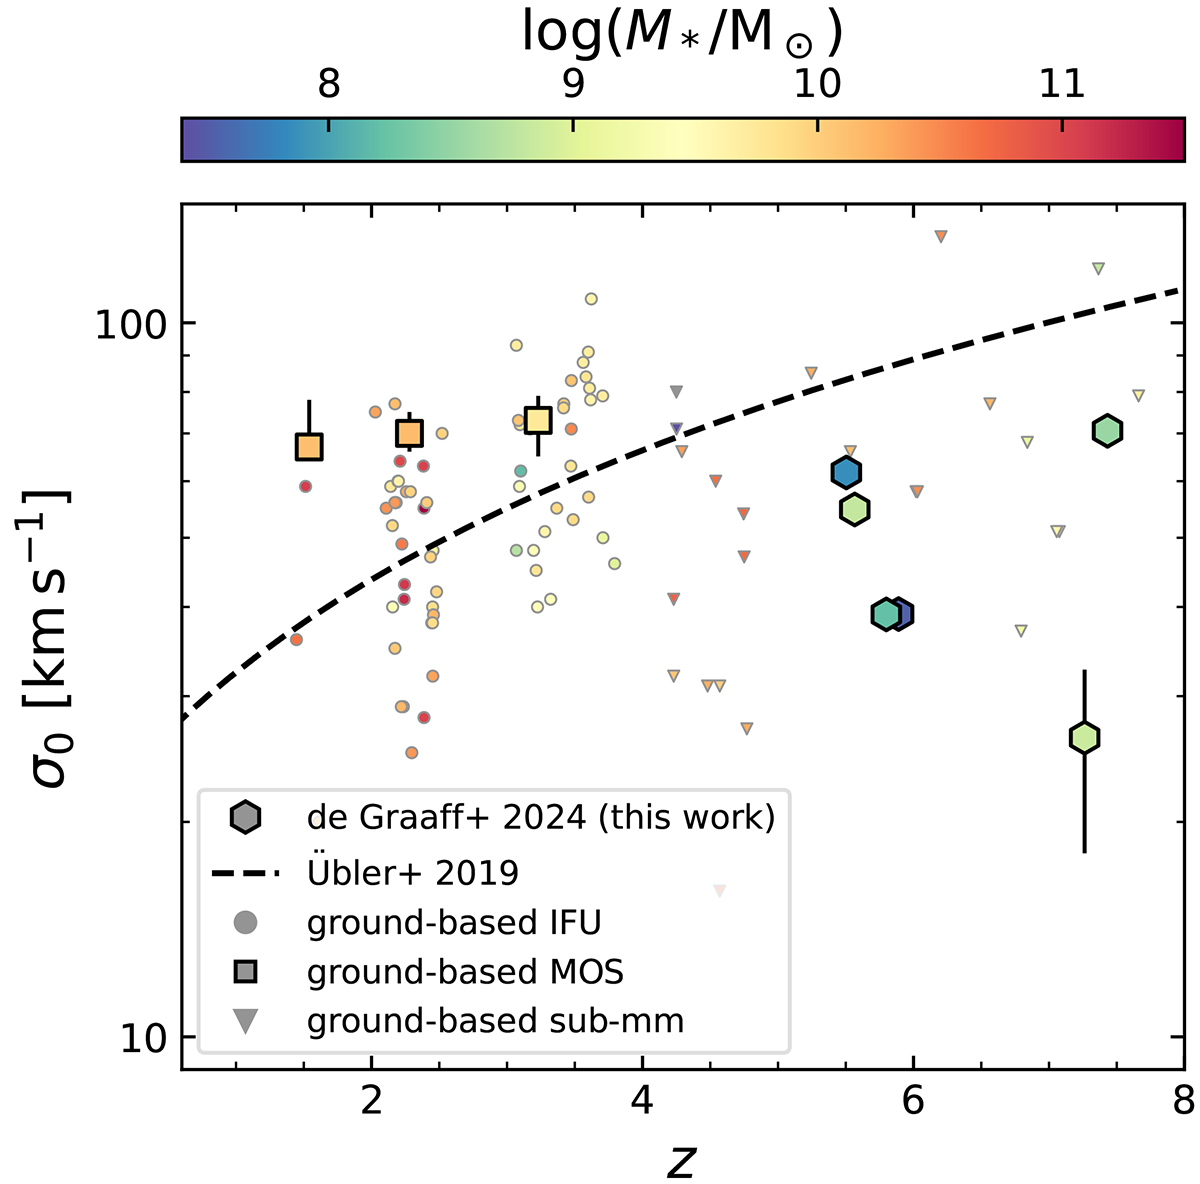
Fig. 5.
Download original image
Velocity dispersion of the ionised gas as a function of redshift. The dashed line shows the fit from Übler et al. (2019) for ionised gas at 0.6 < z < 2.6 extrapolated to higher redshifts, while the circles show results from a selection of ground-based IFU surveys in the near-infrared (Turner et al. 2017; Förster Schreiber et al. 2018) and the squares the results from ground-based near-infrared MOS data (the resolved and aligned sample of Price et al. 2020). The blue triangles show results from various studies with ALMA that measure the kinematics of the cold gas for massive, dusty star-forming galaxies (Neeleman et al. 2020; Rizzo et al. 2020; Fraternali et al. 2021; Lelli et al. 2021; Rizzo et al. 2021; Herrera-Camus et al. 2022; Parlanti et al. 2023).
Current usage metrics show cumulative count of Article Views (full-text article views including HTML views, PDF and ePub downloads, according to the available data) and Abstracts Views on Vision4Press platform.
Data correspond to usage on the plateform after 2015. The current usage metrics is available 48-96 hours after online publication and is updated daily on week days.
Initial download of the metrics may take a while.