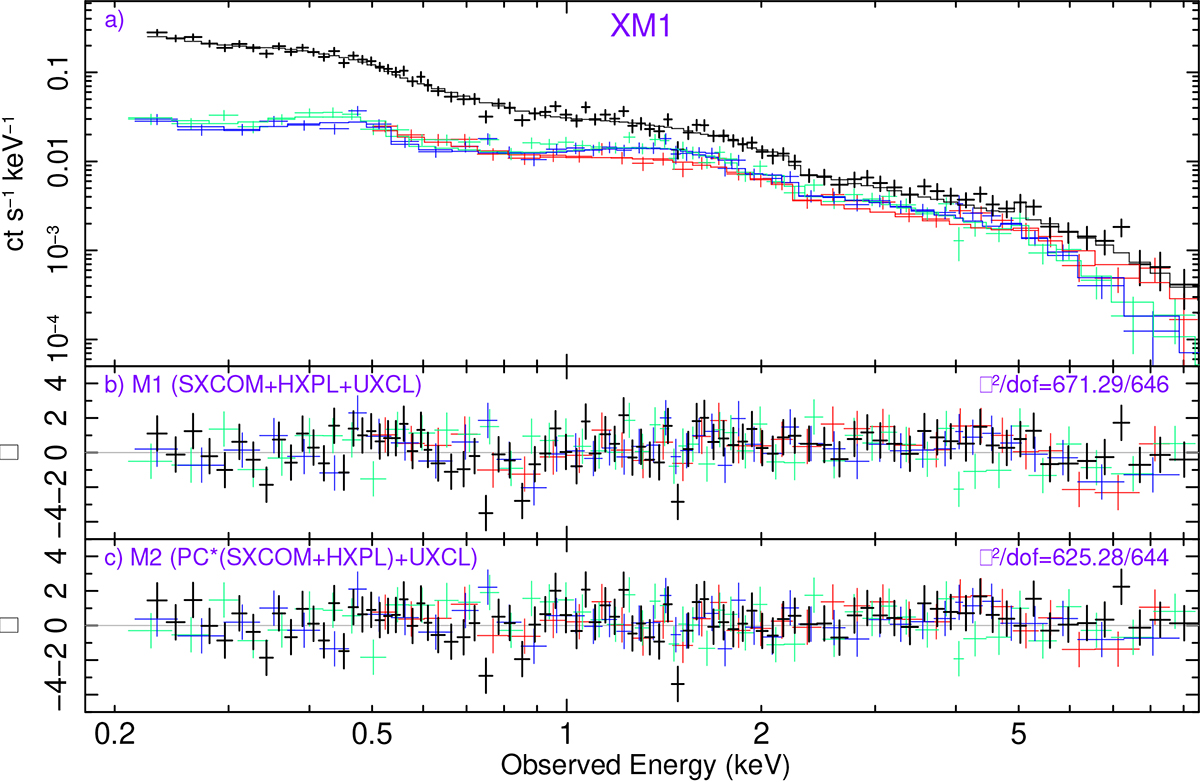
Fig. 5.
Download original image
Same as Fig. 4, but for XM1. In panel a, crosses denote the counts spectra, and the histograms denote the best-fitting M2 (“PC*(SXCOM+HXPL)+UXCL”) model. In panels b and c, respectively, we plot the χ residuals for the best-fitting M1 (“SXCOM+HXPL+UXCL”) model (no obscuration), and for our preferred model, M2 (“PC*(SXCOM+HXPL)+UXCL”; with obscuration).
Current usage metrics show cumulative count of Article Views (full-text article views including HTML views, PDF and ePub downloads, according to the available data) and Abstracts Views on Vision4Press platform.
Data correspond to usage on the plateform after 2015. The current usage metrics is available 48-96 hours after online publication and is updated daily on week days.
Initial download of the metrics may take a while.