Fig. 4.
Download original image
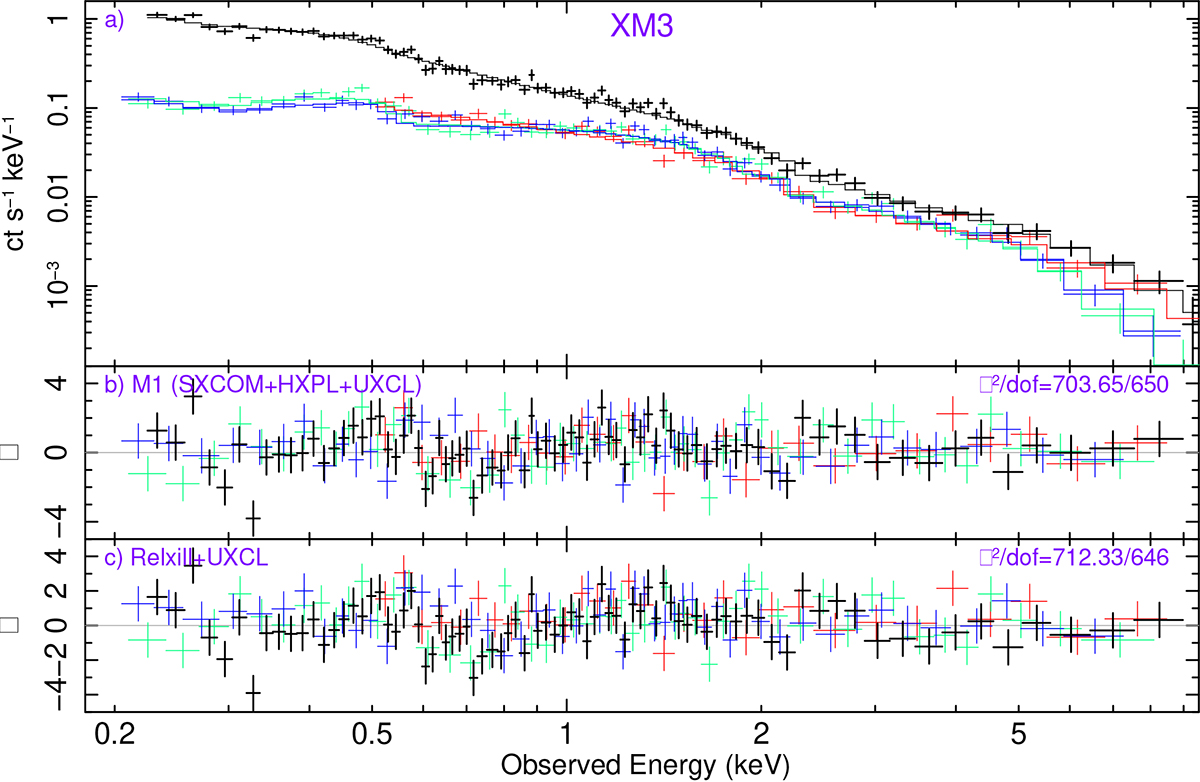
Spectral data and fits for XM3. Black, red, green, and blue denote pn0, pn14, MOS1, and MOS2, respectively. Data have been rebinned by a factor of 3 for clarity. In panel a, crosses denote the counts spectra, and the histograms denote the best-fitting M1 (“SXCOM+HXPL+UXCL”) model. The corresponding χ residuals are plotted in panel b. In this model, reflected emission is modeled with U XCLUMPY. In panel c, we plot the χ residuals for the best-fitting model wherein the soft X-ray excess and Compton reflected component are modeled as blurred, ionized reflection via RELXILL.
Current usage metrics show cumulative count of Article Views (full-text article views including HTML views, PDF and ePub downloads, according to the available data) and Abstracts Views on Vision4Press platform.
Data correspond to usage on the plateform after 2015. The current usage metrics is available 48-96 hours after online publication and is updated daily on week days.
Initial download of the metrics may take a while.