Fig. 3.
Download original image
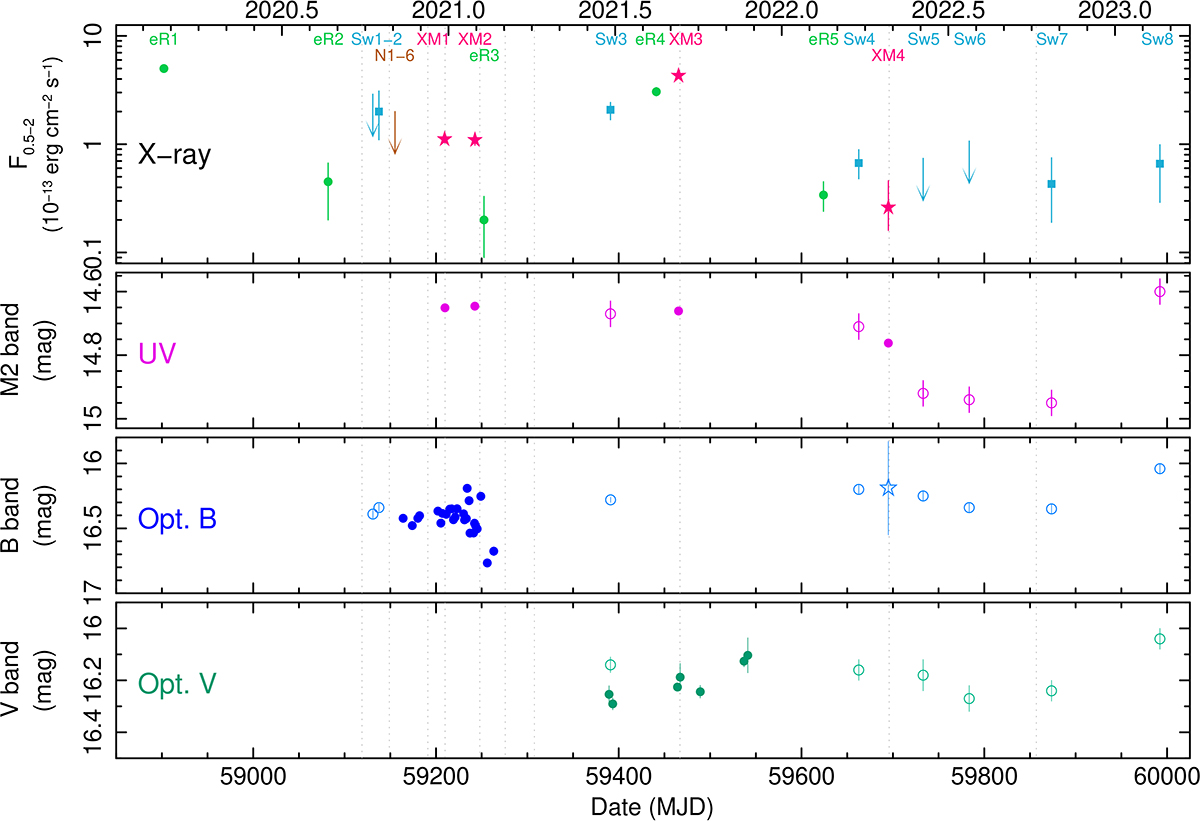
Overview of multiband light curves. The top panel shows the soft X-ray (0.5−2.0 keV) fluxes across all observations. Green, blue, and red denote eRASS, Swift XRT, and XMM-Newton EPIC, respectively; the brown upper limit denotes the combined NICER observations. The corresponding observation abbreviation is written above each point. The middle panel shows the UVM2 photometric Vega magnitudes from XMM-Newton OM (filled circles) and Swift UVOT (open circles). The bottom two panels show B- and V-band photometry from ground-based measurements (filled circles), Swift UVOT (open circles), and XMM-Newton OM (open star). The optical and UV magnitudes plotted here are not corrected for Galactic absorption. XMM-NewtonM2 and B magnitudes were matched to those of Swift UVOT following the cross calibration procedure described in Appendix B. In each panel, there are some data points whose error bars are smaller than the data point symbol. Vertical dotted lines indicate the dates of optical spectroscopic measurements.
Current usage metrics show cumulative count of Article Views (full-text article views including HTML views, PDF and ePub downloads, according to the available data) and Abstracts Views on Vision4Press platform.
Data correspond to usage on the plateform after 2015. The current usage metrics is available 48-96 hours after online publication and is updated daily on week days.
Initial download of the metrics may take a while.