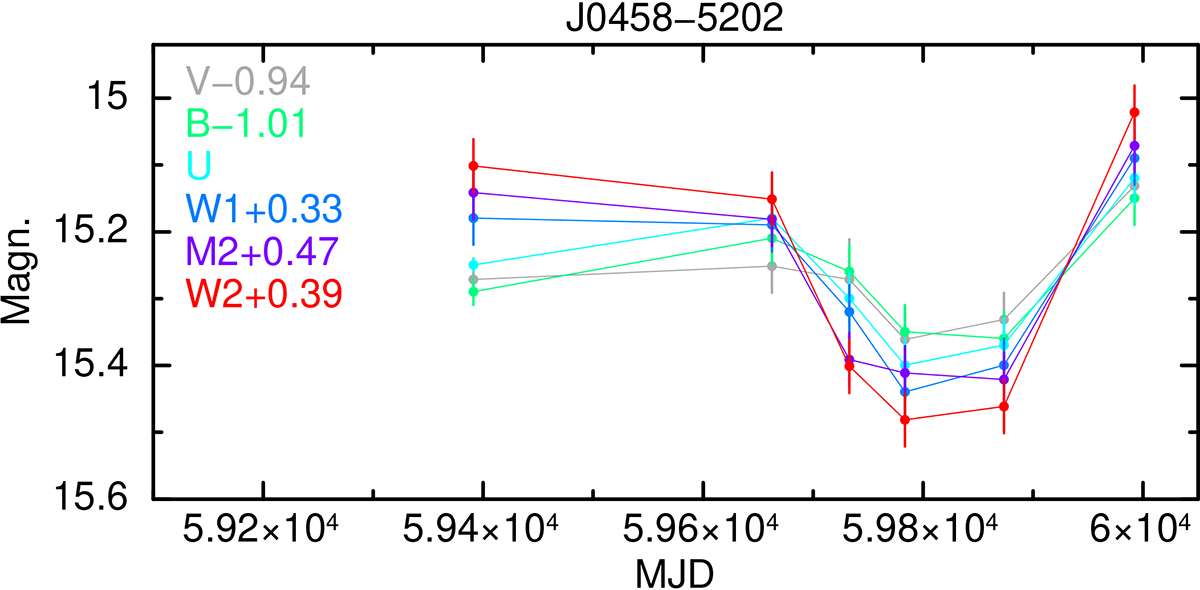
Fig. 2.
Download original image
Optical/UV light curves of J0458−5202 for observations Sw3–8, in which Swift UVOT observed with all six filters. For this overplot, the V, B, W1, M2, and W2-band light curves have been offset by the magnitude values indicated in the top left corner such that their mean magnitudes across all six observations match the mean of the U-band light curve. This action helps to illustrate the optical/UV spectral variability as a function of flux; as demonstrated in Sect. 4, such spectral variability is consistent with bluer-when-brighter behavior, and not a product of variable extinction.
Current usage metrics show cumulative count of Article Views (full-text article views including HTML views, PDF and ePub downloads, according to the available data) and Abstracts Views on Vision4Press platform.
Data correspond to usage on the plateform after 2015. The current usage metrics is available 48-96 hours after online publication and is updated daily on week days.
Initial download of the metrics may take a while.