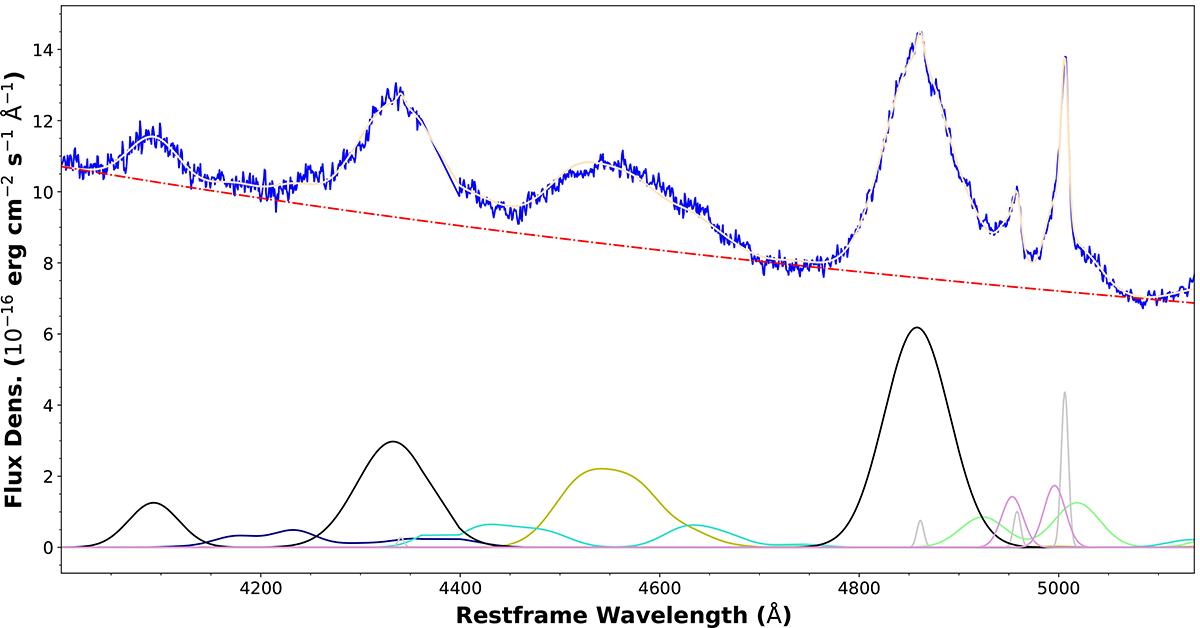
Fig. 15.

Download original image
Sample spectral deconvolution for the Hβ fitting; shown here is spectrum #2. The data are plotted in blue. The red-dashed line is the power-law continuum. Black denotes broad Balmer components; gray denotes narrow [O III] and Balmer components; pink denotes the broad and blueshifted [O III] components; and navy blue, yellow, turquoise, and green denote the P-, F-, I Zw 1-, and S-groups of Fe II emission. The total model is shown in beige. A host galaxy template was included in the fit, but the best-fit value of its amplitude is zero, as the AGN continuum dominates.
Current usage metrics show cumulative count of Article Views (full-text article views including HTML views, PDF and ePub downloads, according to the available data) and Abstracts Views on Vision4Press platform.
Data correspond to usage on the plateform after 2015. The current usage metrics is available 48-96 hours after online publication and is updated daily on week days.
Initial download of the metrics may take a while.


