Open Access
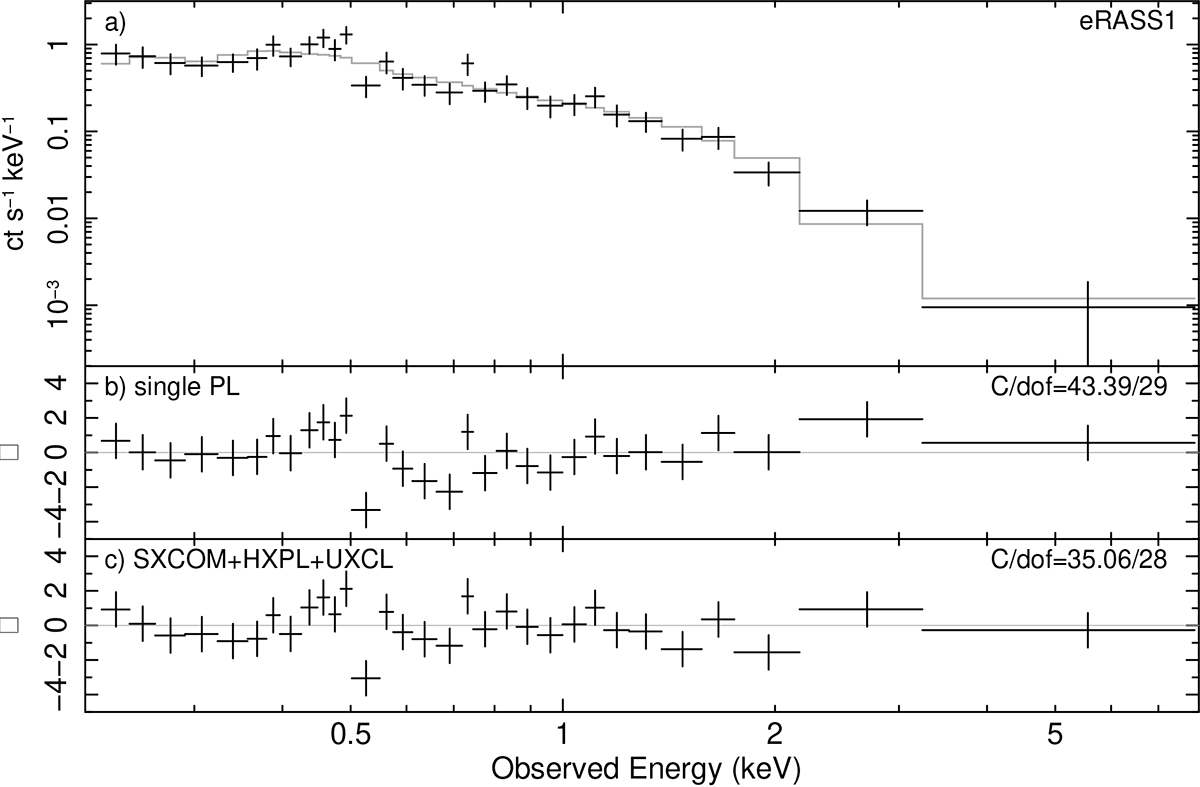
Fig. 11.
Download original image
Spectral data for observation eR1. In the top panel, crosses denote the counts spectra, and the histograms denote the best-fitting M1 (“SXCOM+HXPL+UXCL”) model, with data-model residuals plotted in panel c. Panel b shows the residuals to a simple power-law fit.
Current usage metrics show cumulative count of Article Views (full-text article views including HTML views, PDF and ePub downloads, according to the available data) and Abstracts Views on Vision4Press platform.
Data correspond to usage on the plateform after 2015. The current usage metrics is available 48-96 hours after online publication and is updated daily on week days.
Initial download of the metrics may take a while.