Fig. 7
Download original image
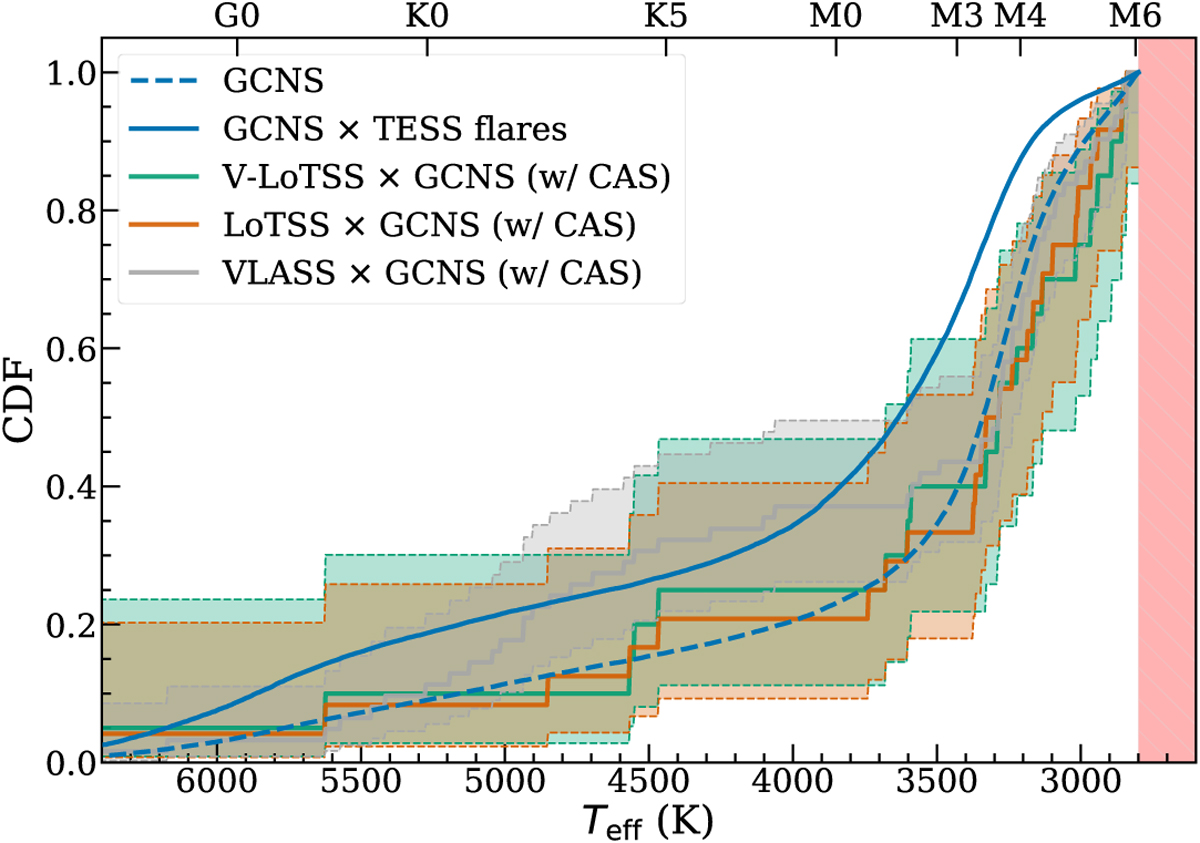
Cumulative distribution functions for the GCNS background distribution (dashed blue), the GCNS × TESS flare distribution (solid blue), the V-LoTSS × GCNS sample (green), the LoTSS × GCNS sample (orange), and the VLASS × GCNS sample (grey), shown as a function of effective temperature Teff. The solid blue line is the product of the dashed blue line and TESS flare rate curve according to Fig. 1d. The shaded regions correspond to the 95% confidence level based on a binomial distribution. The stars with Teff < 2800 K (around spectral type M6; shaded red box) are excluded in our analysis due to their incompleteness in TESS. The top axis of the CDF plots indicates the nominal stellar spectral types (Pecaut & Mamajek 2013).
Current usage metrics show cumulative count of Article Views (full-text article views including HTML views, PDF and ePub downloads, according to the available data) and Abstracts Views on Vision4Press platform.
Data correspond to usage on the plateform after 2015. The current usage metrics is available 48-96 hours after online publication and is updated daily on week days.
Initial download of the metrics may take a while.