Fig. 5
Download original image
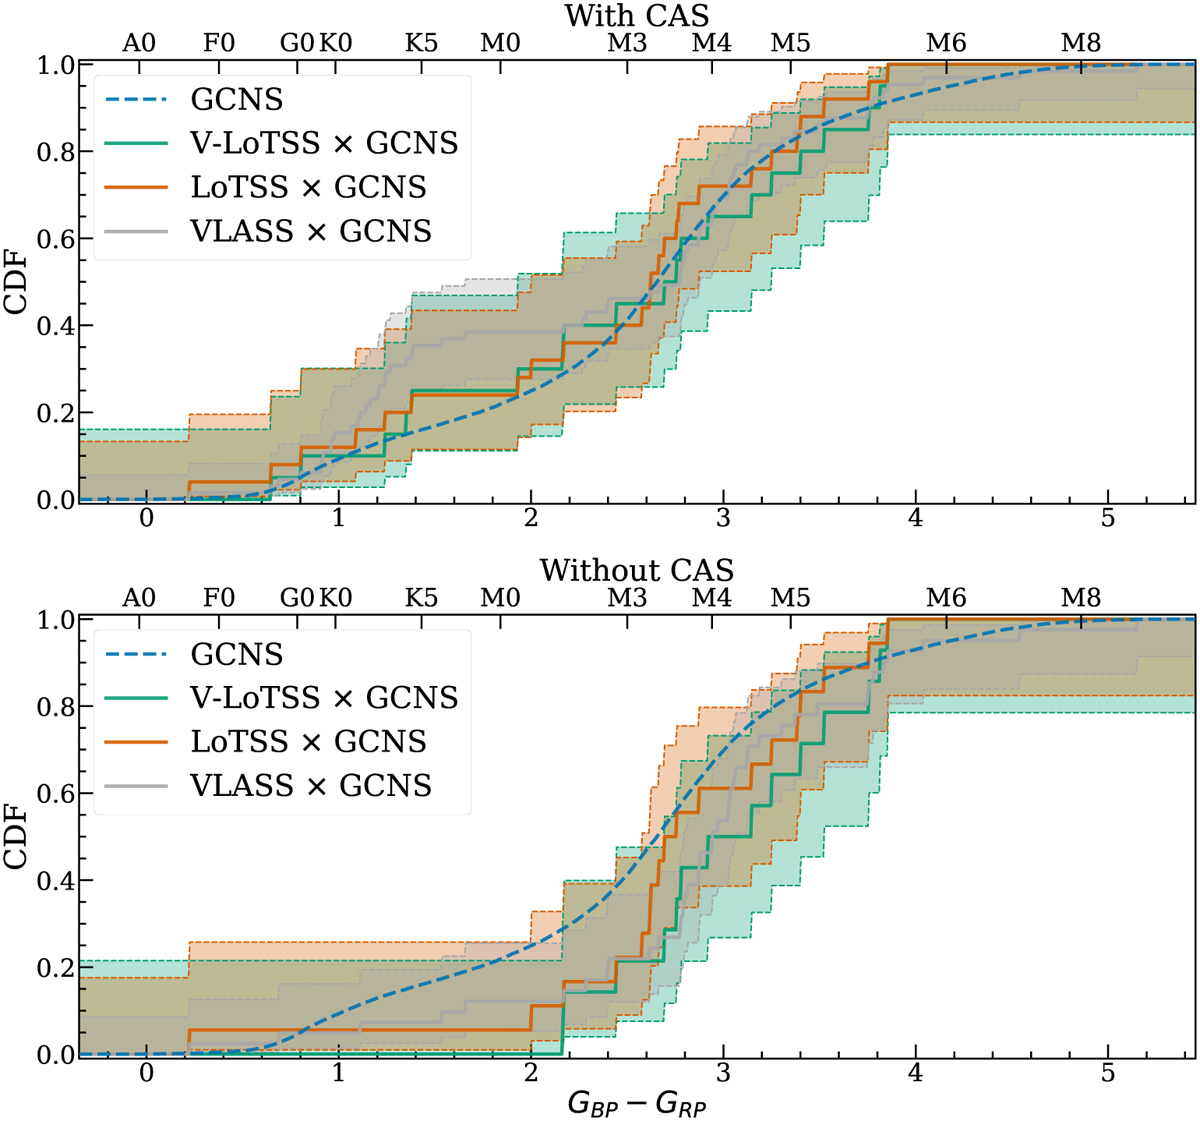
Cumulative distribution functions for the GCNS background distribution (dashed blue), the V-LoTSS × GCNS sample (green), the LoTSS × GCNS sample (orange), and the VLASS × GCNS sample (grey), shown as a function of Gaia colour GBP − GRP. The top panel shows the two radio-detected populations with the inclusion of chromospherically active stellar (CAS) systems. The bottom panel shows the population without them. The shaded regions correspond to the 95% confidence level based on a binomial distribution. As the number of sources in GCNS is much larger than the radio-detected populations, the confidence interval of GCNS is negligible. The top axis of the CDF plots indicates the nominal stellar spectral types (Pecaut & Mamajek 2013).
Current usage metrics show cumulative count of Article Views (full-text article views including HTML views, PDF and ePub downloads, according to the available data) and Abstracts Views on Vision4Press platform.
Data correspond to usage on the plateform after 2015. The current usage metrics is available 48-96 hours after online publication and is updated daily on week days.
Initial download of the metrics may take a while.