Fig. B.1
Download original image
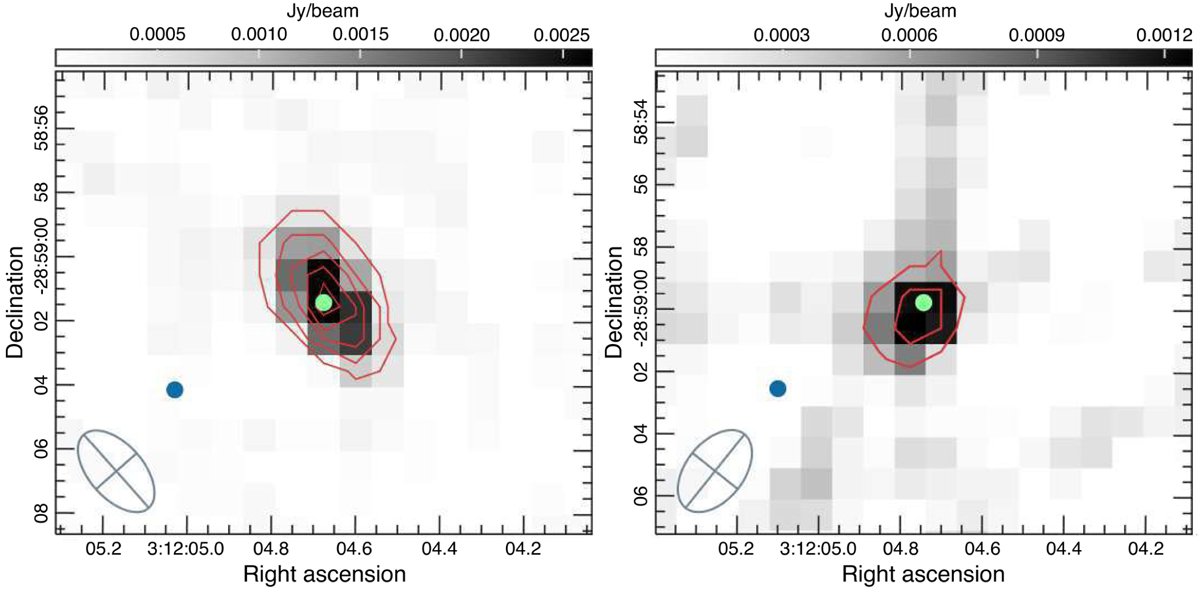
VLASS Epoch 1 (left panel) and Epoch 2 (right panel) images using CIRADA cutout service,10centred at the corresponding radio source. In both images the green dot represents the Gaia position of α For B with proper motion correction, and the blue dot represents that of α For A. The FWHM beam size is shown in the bottom left corner of each image as a grey crossed circle. The rms noise σ is around 140 µJy in both epochs. The contour levels are in steps of 4σ (i.e. 4σ, 8σ, 12σ, and so on). The peak flux of the source is around 3.3 mJy for Epoch 1 and 1.5 mJy for Epoch 2.
Current usage metrics show cumulative count of Article Views (full-text article views including HTML views, PDF and ePub downloads, according to the available data) and Abstracts Views on Vision4Press platform.
Data correspond to usage on the plateform after 2015. The current usage metrics is available 48-96 hours after online publication and is updated daily on week days.
Initial download of the metrics may take a while.