Fig. 10
Download original image
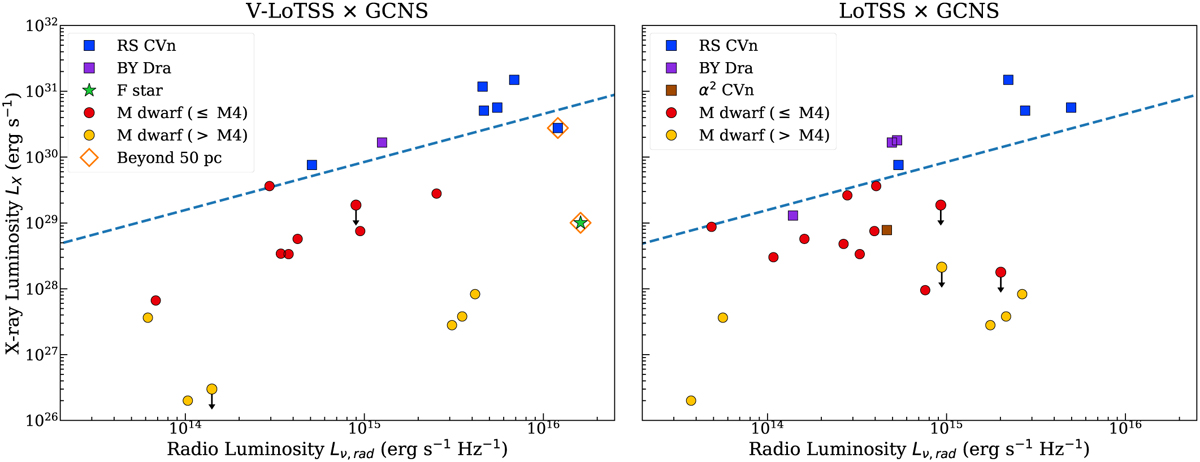
Radio-detected populations (V-LoTSS in the left panel, LoTSS in the right panel) plotted against the canonical Güdel-Benz relationship (GBR) represented by the dashed blue line: ![]() (Williams et al. 2014), where LX is the soft (0.1–2.4 keV) X-ray luminosity and Lv,rad is the 144 MHz total-flux radio luminosity for the LOFAR population. The radio sources without a detectable X-ray luminosity are indicated with a downward-pointing arrow and are shown as 3σ upper limits. Colours and symbols are as in Fig. 2, with the additional classification of M dwarfs beyond M4 (yellow circles) motivated by the M4 transition mentioned in Sect. 4.3.2.
(Williams et al. 2014), where LX is the soft (0.1–2.4 keV) X-ray luminosity and Lv,rad is the 144 MHz total-flux radio luminosity for the LOFAR population. The radio sources without a detectable X-ray luminosity are indicated with a downward-pointing arrow and are shown as 3σ upper limits. Colours and symbols are as in Fig. 2, with the additional classification of M dwarfs beyond M4 (yellow circles) motivated by the M4 transition mentioned in Sect. 4.3.2.
Current usage metrics show cumulative count of Article Views (full-text article views including HTML views, PDF and ePub downloads, according to the available data) and Abstracts Views on Vision4Press platform.
Data correspond to usage on the plateform after 2015. The current usage metrics is available 48-96 hours after online publication and is updated daily on week days.
Initial download of the metrics may take a while.