Fig. 1
Download original image
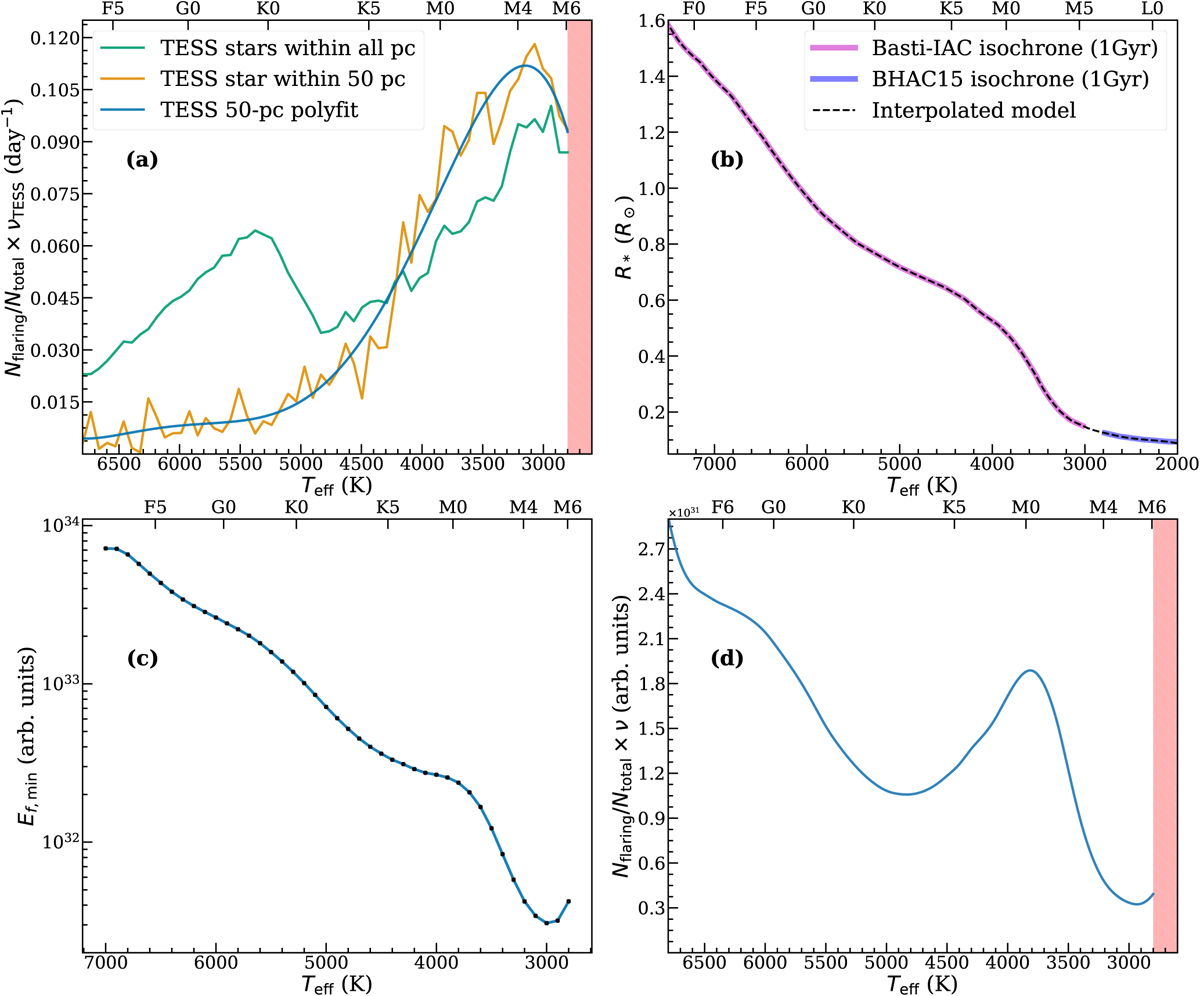
TESS flare statistics and debiasing. The top horizontal axis of each subpanel indicates the nominal stellar spectral types (Pecaut & Mamajek 2013). (a) Average TESS ensemble flare rate, defined as the fraction of flaring stars Nflaring/Ntotal in the TESS short-cadence years 1 and 2 observations, weighted by the average flare rate vTESS, as a function of stellar effective temperature Teff. vTESS follows the definition from Eq. (2). The green curve shows the average TESS ensemble flare rate using the entire TESS flare statistics which suffers greatly from TESS sampling bias (see Sect. 3.3.1), whereas the orange curve only considers TESS stars within 50pc, with the blue curve as its polynomial fit (from numpy.polyfit; deg = 5) used for subsequent analysis. M dwarfs later than ~M6 were not observed in a large enough sample size due to TESS target selection (which avoids very faint stars), and are thus excluded (represented by the red region). (b) Stellar radius R, as a function of Teff. The Basti-IAC isochrone model (Hidalgo et al. 2018) and the BHAC15 isochrone model (Baraffe et al. 2015) are combined to create our interpolated model. (c) Minimum flare energy Ef,min detectable by TESS on a particular star with effective temperature Teff. The unit for the flare energy is arbitrary since we are only interested in the shape of the Ef,min vs. spectral type curve. (d) Same as Fig. 1a, but with the debiased flare rate v instead of the TESS-observed flare rate vTESS. This debiased average-TESS-ensemble-flare-rate curve is obtained by multiplying the two blue curves in Figs. 1a and c.
Current usage metrics show cumulative count of Article Views (full-text article views including HTML views, PDF and ePub downloads, according to the available data) and Abstracts Views on Vision4Press platform.
Data correspond to usage on the plateform after 2015. The current usage metrics is available 48-96 hours after online publication and is updated daily on week days.
Initial download of the metrics may take a while.