Fig. 4.
Download original image
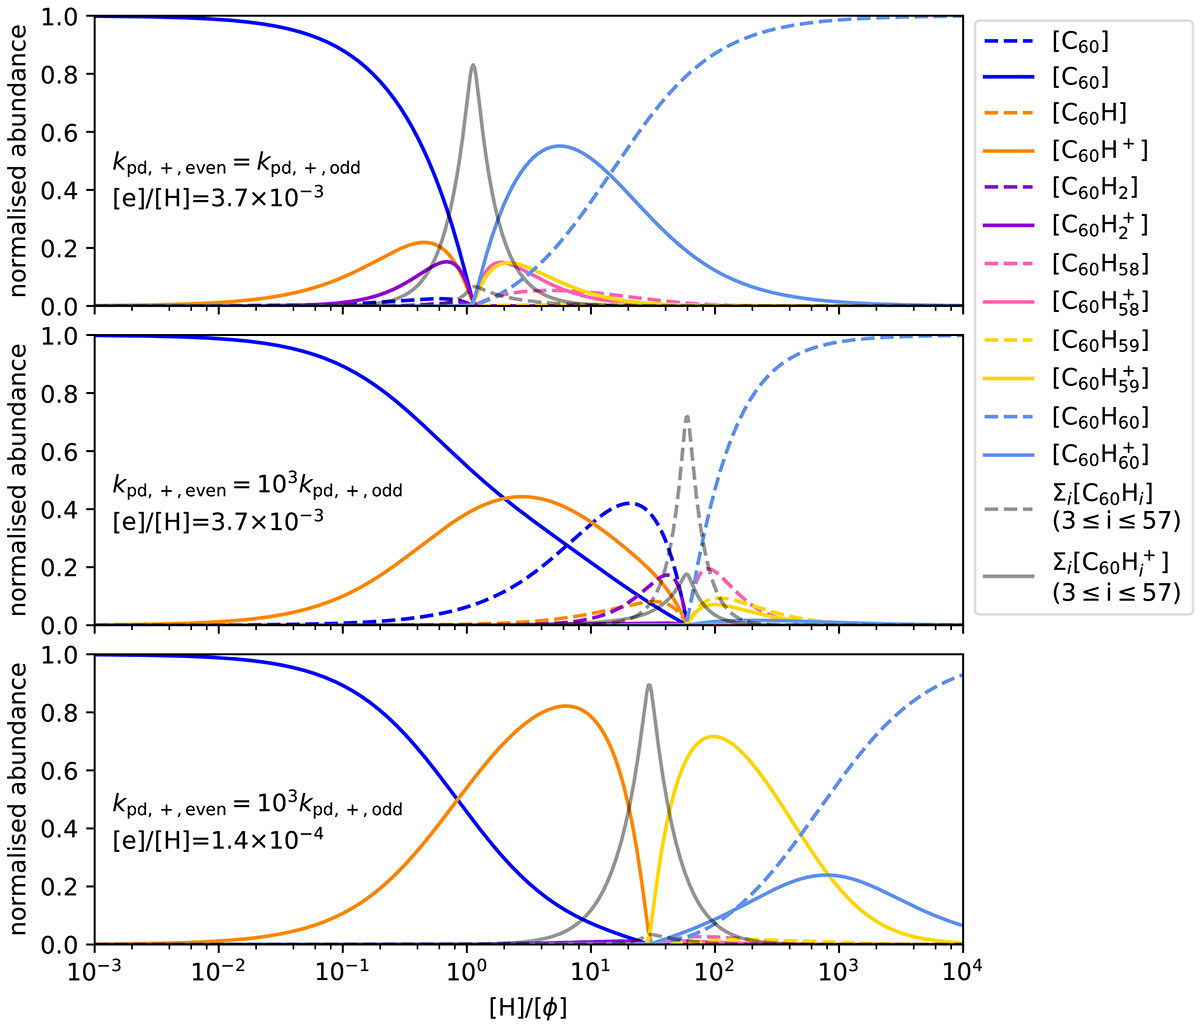
Model-predicted hydrogenation and charge states for fullerene C60 as a function of the hydrogen-to-flux ratio, given two different values for the photo-dissociation rate of the even-numbered cationic fulleranes, and two different values for the electron to hydrogen density ratio. Solid lines correspond to singly ionised states and dashed lines to neutral states. The solid and dashed grey lines indicate the respective sums of ion and neutral abundances that are not plotted individually (![]() ). The difference between the top and centre panels demonstrates the effect of a 103 times larger photo-dissociation rate (kpd) for even compared to odd H cover. Comparison of the centre and bottom panels illustrates the effect of [e]/[H] on the hydrogenation and charge state distribution.
). The difference between the top and centre panels demonstrates the effect of a 103 times larger photo-dissociation rate (kpd) for even compared to odd H cover. Comparison of the centre and bottom panels illustrates the effect of [e]/[H] on the hydrogenation and charge state distribution.
Current usage metrics show cumulative count of Article Views (full-text article views including HTML views, PDF and ePub downloads, according to the available data) and Abstracts Views on Vision4Press platform.
Data correspond to usage on the plateform after 2015. The current usage metrics is available 48-96 hours after online publication and is updated daily on week days.
Initial download of the metrics may take a while.