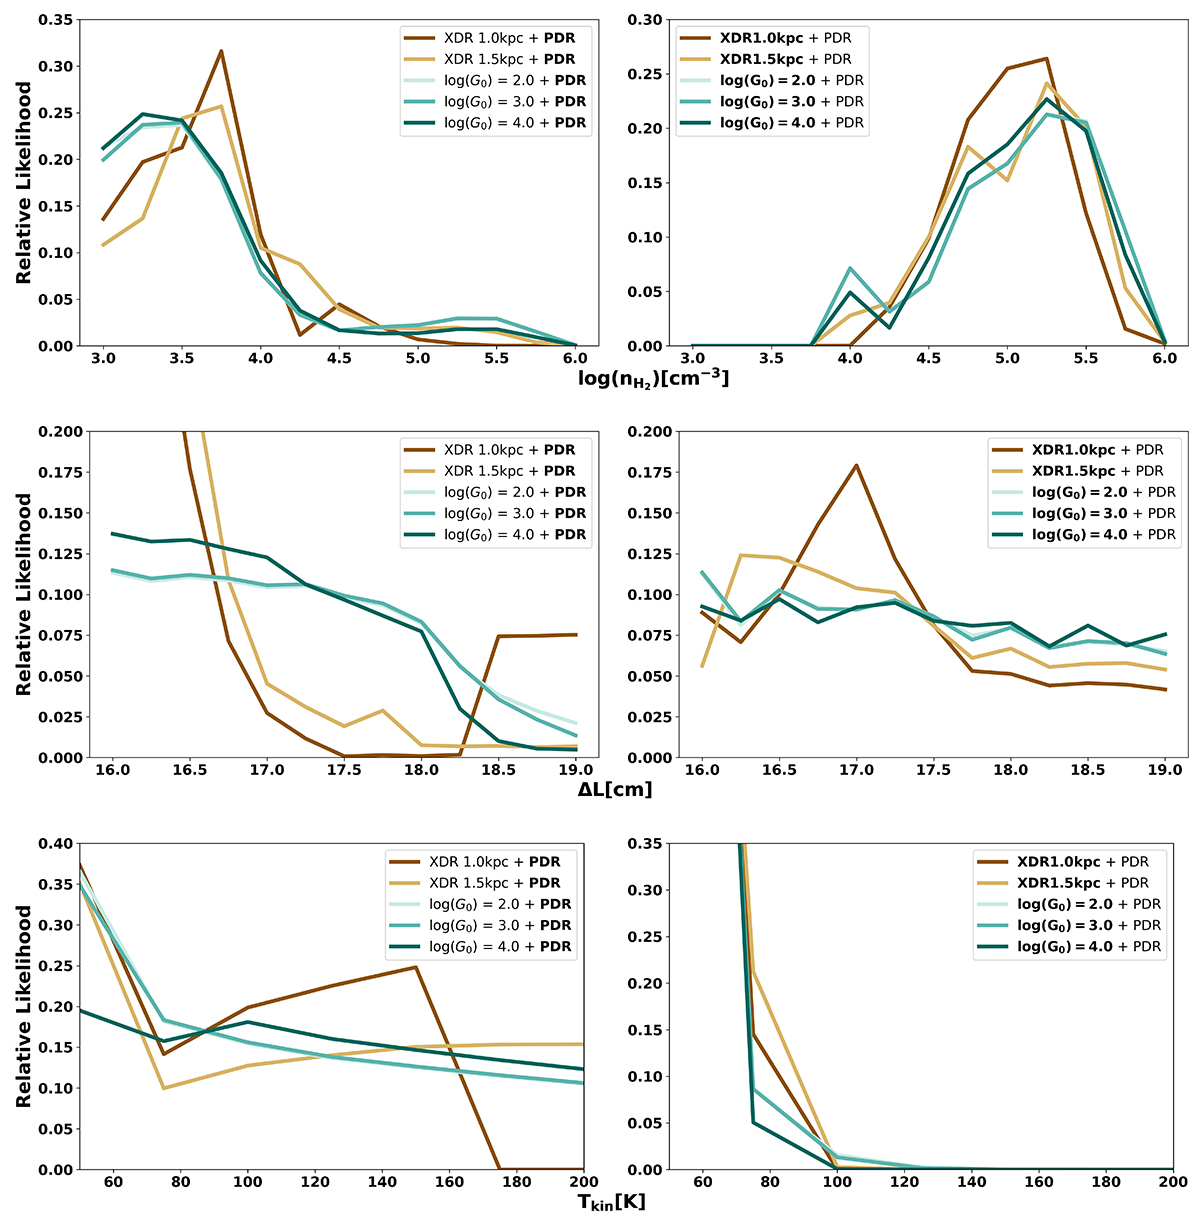
Fig. 9.
Download original image
Relative likelihood of each input parameter to MOLPOP-CEP in different heating scenarios. The left column shows the relative likelihood of each parameter in the PDR component modeled by log(G0) = 0.0 (in bold in the legend) and the right shows the same for PDRs scaled to log(G0) = 2.0, 3.0, and 4.0 or an XDR at distances from the line emitting region of 1.0 kpc and 1.5 kpc (in bold in the legend). These models correspond to those shown in Fig. 8.
Current usage metrics show cumulative count of Article Views (full-text article views including HTML views, PDF and ePub downloads, according to the available data) and Abstracts Views on Vision4Press platform.
Data correspond to usage on the plateform after 2015. The current usage metrics is available 48-96 hours after online publication and is updated daily on week days.
Initial download of the metrics may take a while.