Fig. 8.
Download original image
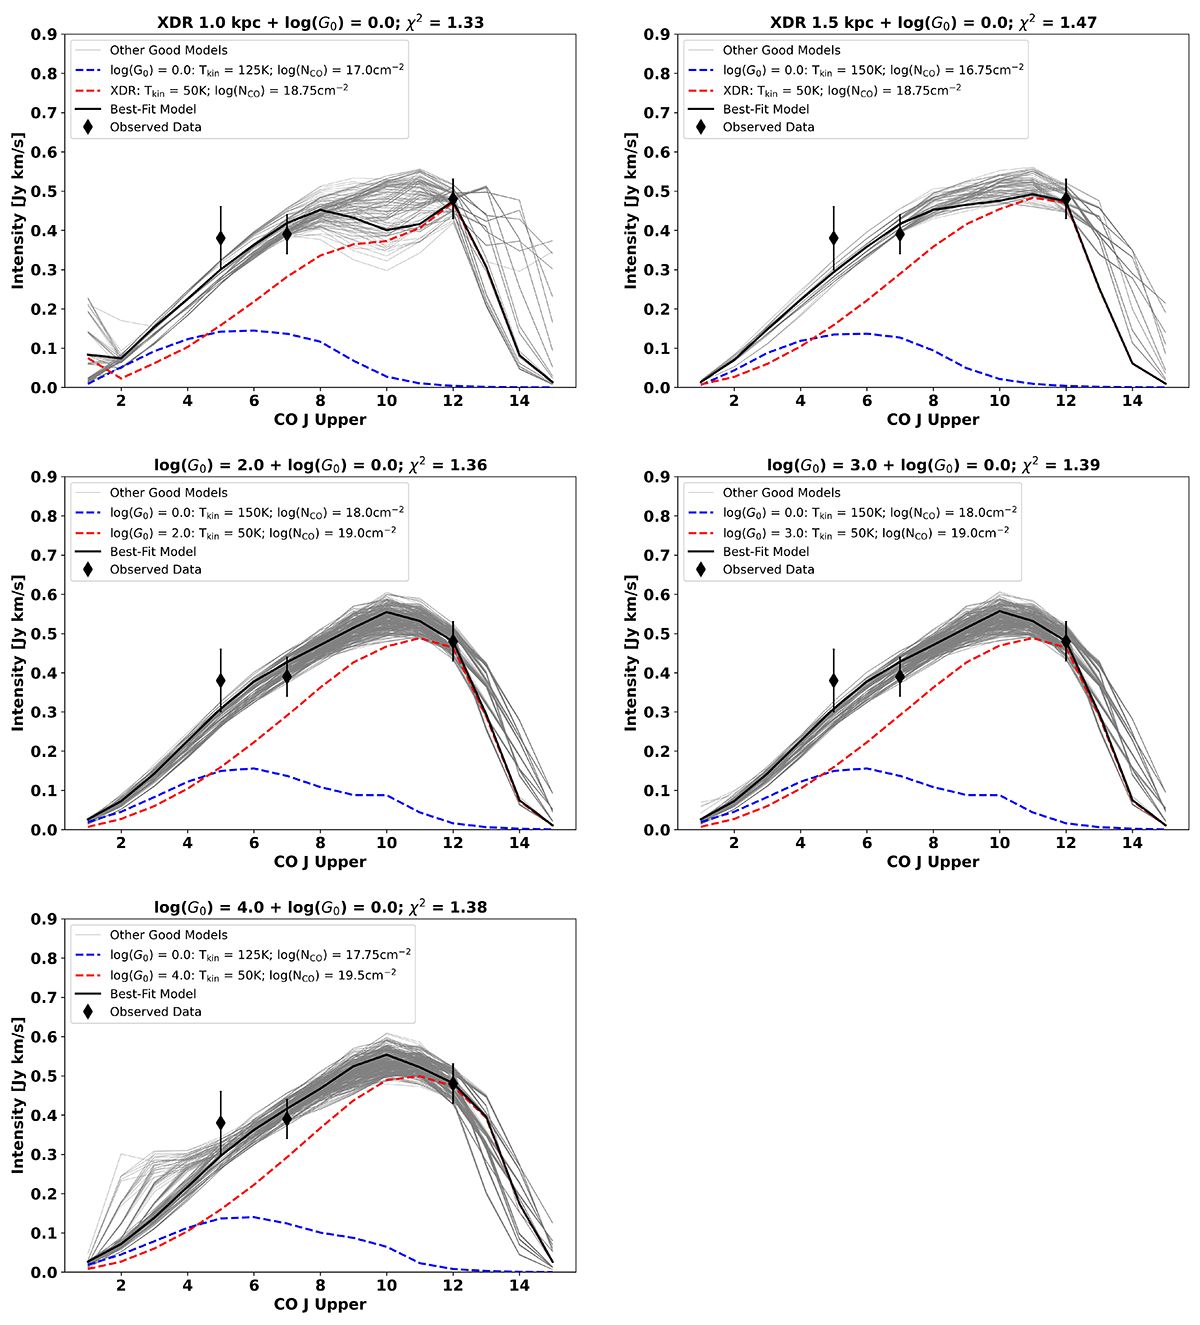
CO SLEDs using a two-component description of the ISM in which one component is represented by PDRs scaled to log(G0) = 0.0 (dashed blue line) and the other is either represented by PDRs scaled to log(G0) = 2.0, 3.0, and 4.0 or an XDR at distances from the line emitting region of 1.0 kpc and 1.5 kpc (dashed red line). The solid black line shows the best-fit composite model and the lighter gray lines show other models within 1σ. We note that although the best-fit models appear to have been normalized to the CO(12–11) line, no such normalization was performed.
Current usage metrics show cumulative count of Article Views (full-text article views including HTML views, PDF and ePub downloads, according to the available data) and Abstracts Views on Vision4Press platform.
Data correspond to usage on the plateform after 2015. The current usage metrics is available 48-96 hours after online publication and is updated daily on week days.
Initial download of the metrics may take a while.