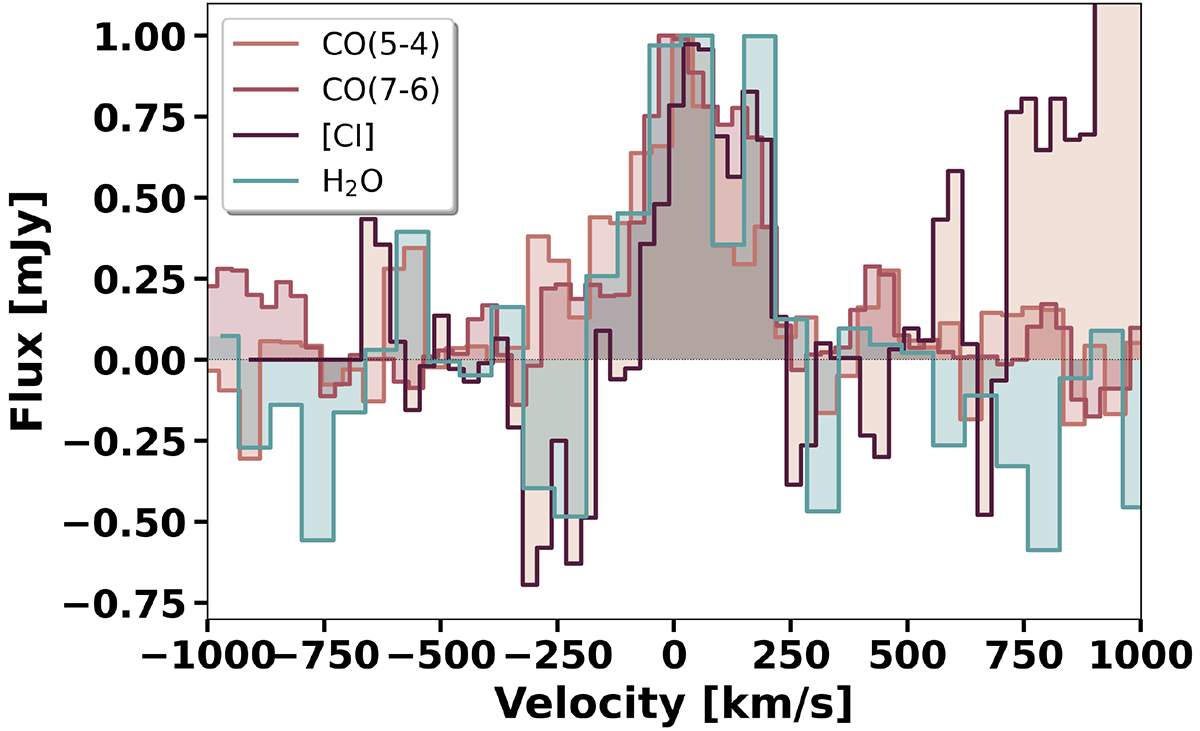
Fig. 4.
Download original image
Comparison of the normalized H2O, CO(5–4) and CO(7–6) spectra. The CO lines are shown in pink and purple and the H2O line is shown in blue. The [C I] line appears at ∼400 km s−1 in the CO(7–6) spectra, and similarly the CO(7–6) line appears in the [C I] line profile at ∼ > 750 km s−1. The line profile of the H2O line broadly follows that of both CO lines as well as the [C I] line.
Current usage metrics show cumulative count of Article Views (full-text article views including HTML views, PDF and ePub downloads, according to the available data) and Abstracts Views on Vision4Press platform.
Data correspond to usage on the plateform after 2015. The current usage metrics is available 48-96 hours after online publication and is updated daily on week days.
Initial download of the metrics may take a while.