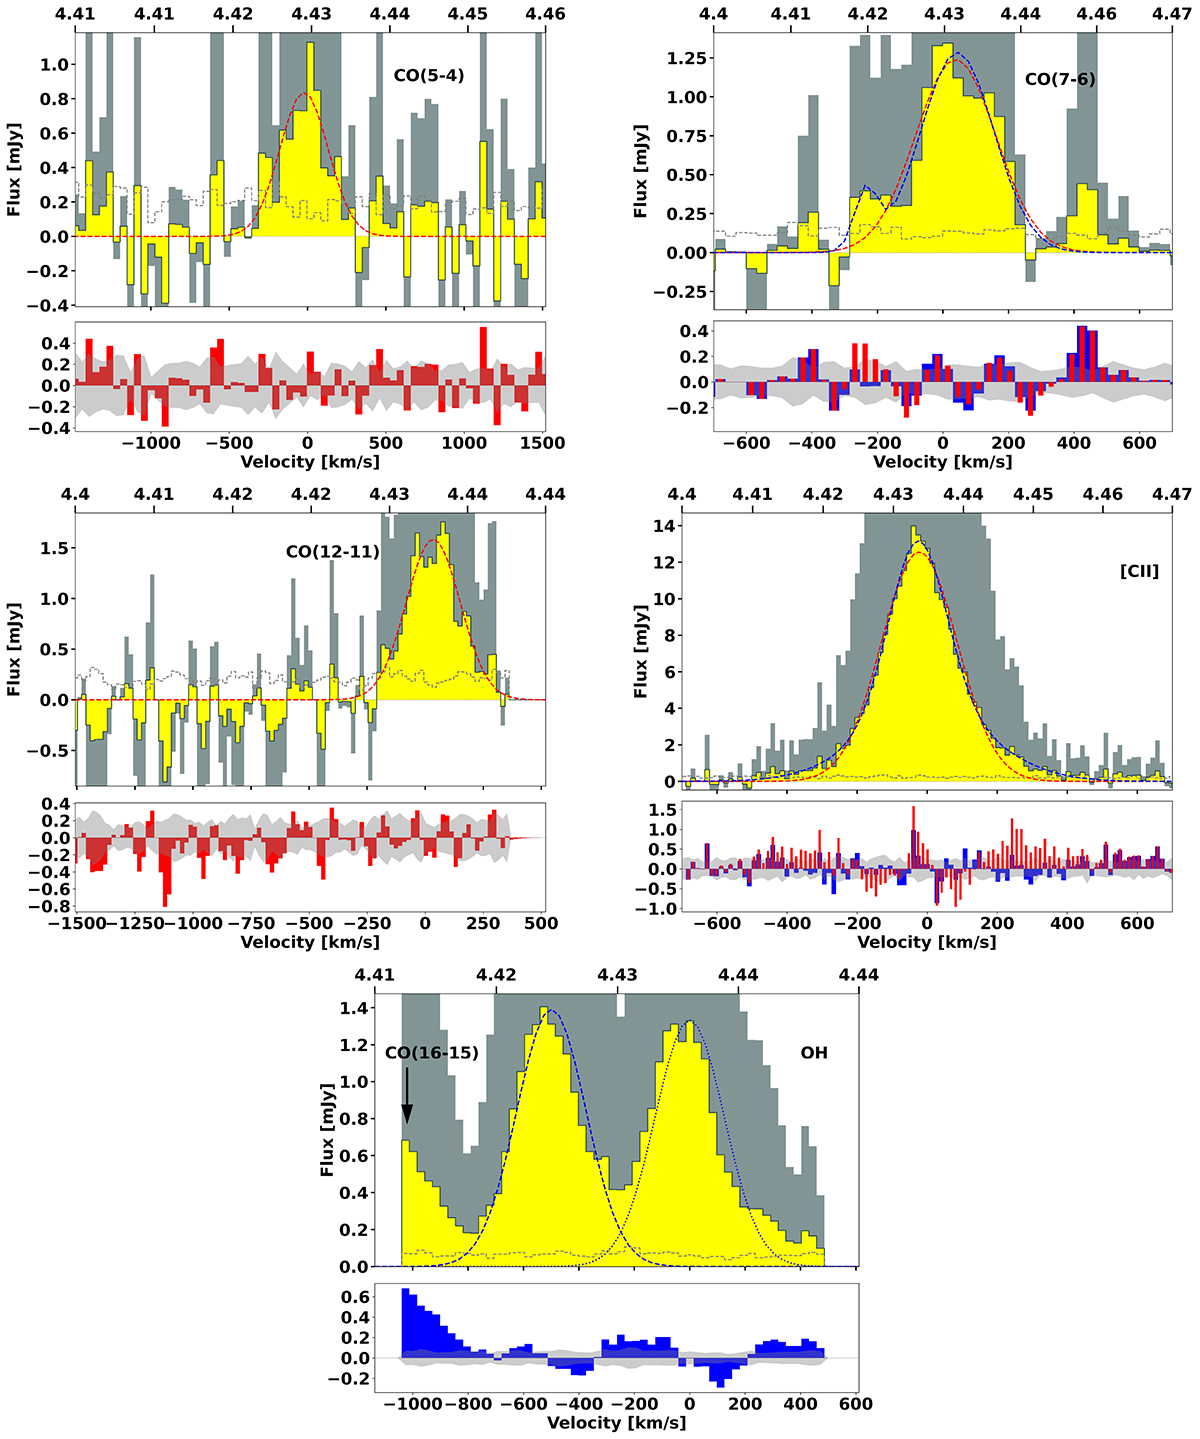
Fig. 3.
Download original image
Spectra of the molecular and atomic species detected in BRI 0952. Right: Lensing magnification corrected spectra, corrected using the process described in Sect. 3.3. The gray background profile is the spectra before lensing correction. Similar to the left panel, single Gaussian fits are shown in red and double Gaussian fits are shown in blue. The dashed gray line represents the rms. The bottom panel shows the residuals from the Gaussian fits where the red corresponds to single fits and the blue to fits using two Gaussian profiles and the gray shaded region represents the rms. The OH redshift-axis is calibrated to the 1834.74735 GHz line. Note that the red residuals in the bottom panel are shown to be narrower than the blue only the increase clarity.
Current usage metrics show cumulative count of Article Views (full-text article views including HTML views, PDF and ePub downloads, according to the available data) and Abstracts Views on Vision4Press platform.
Data correspond to usage on the plateform after 2015. The current usage metrics is available 48-96 hours after online publication and is updated daily on week days.
Initial download of the metrics may take a while.