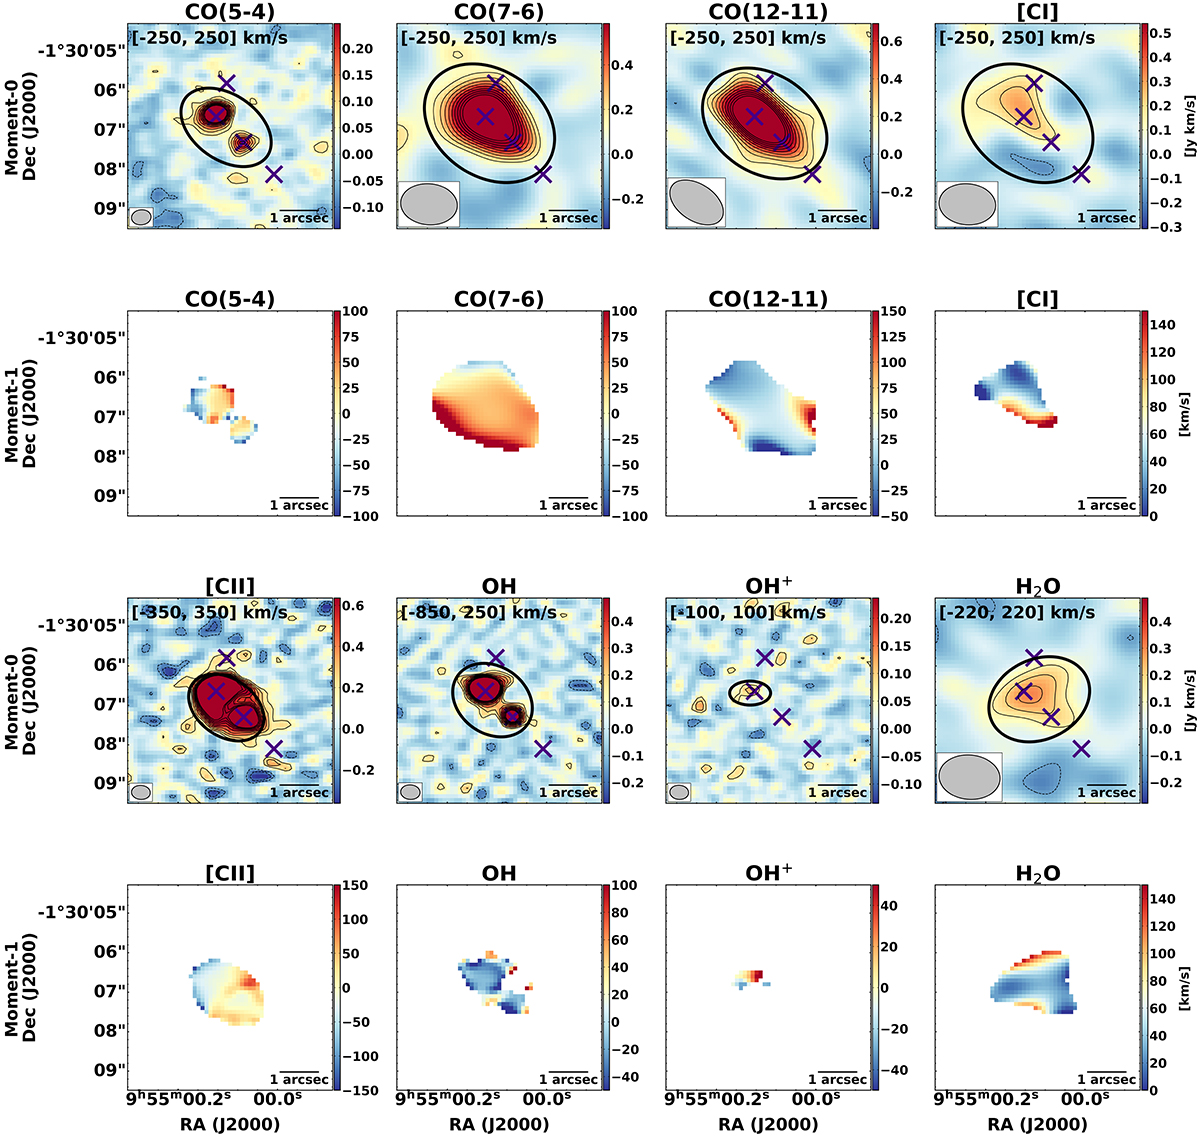
Fig. 2.
Download original image
Moment-0 and moment-1 maps of atomic and molecular species detected in BRI 0952. Rows one and three show the moment-0 maps for the entire field. The purple “X”s show the position of Img-N and Img-S of the quasar as well as the location of the two companions, Comp-N and Comp-SW, detected in Kade et al. (2023). Contours are at −3, −2, 2, 3, 4, 5, 6, 7, 8, 9, and 10σ levels. The black ellipses show the region of spectral extraction and the velocity range used for the extraction is show at the top of the image. Rows two and four show the moment-1 maps within the region of spectral extraction where the flux is limited to only that above a 2σ level. The synthesized beam is shown in the bottom left of each image.
Current usage metrics show cumulative count of Article Views (full-text article views including HTML views, PDF and ePub downloads, according to the available data) and Abstracts Views on Vision4Press platform.
Data correspond to usage on the plateform after 2015. The current usage metrics is available 48-96 hours after online publication and is updated daily on week days.
Initial download of the metrics may take a while.