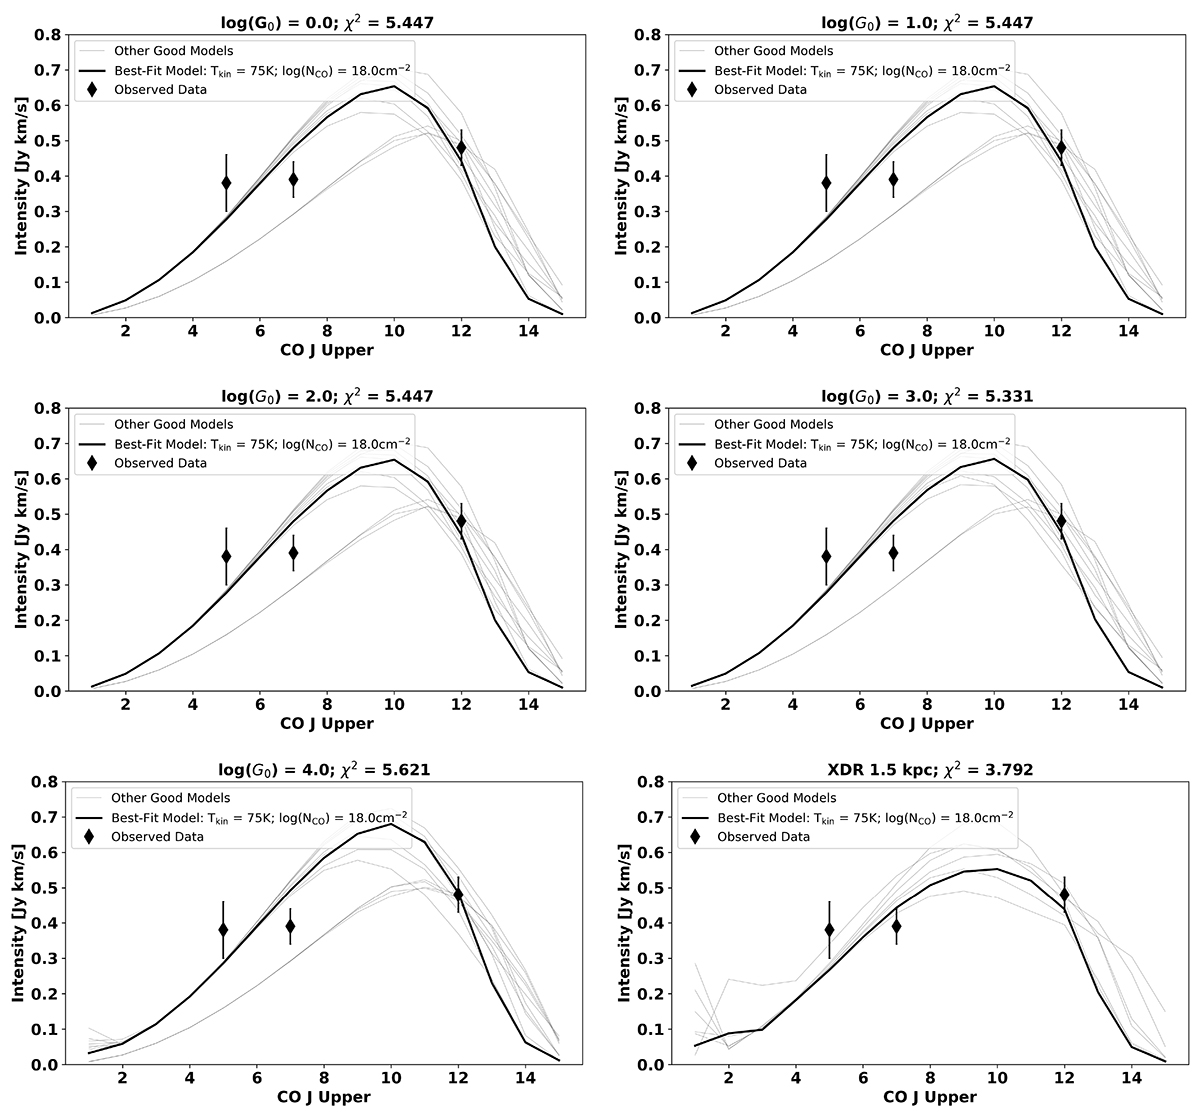
Fig. D.1.
Download original image
CO SLEDs showing different heating mechanisms including CMB heating, PDRs (log(G0) = 0.0, 1.0, 2.0, 3.0, 4.0), and AGN heating via X-rays at 1.0 kpc and 1.5 kpc. The solid black curve is the best-fit model and the lighter gray lines show the models within the lowest 1% of the χ2 values for the different models. Note that the method we employ for isolating the best-fit models is a percentile cut, and it is for this reason that a different number of models are shown for different heating mechanisms.
Current usage metrics show cumulative count of Article Views (full-text article views including HTML views, PDF and ePub downloads, according to the available data) and Abstracts Views on Vision4Press platform.
Data correspond to usage on the plateform after 2015. The current usage metrics is available 48-96 hours after online publication and is updated daily on week days.
Initial download of the metrics may take a while.