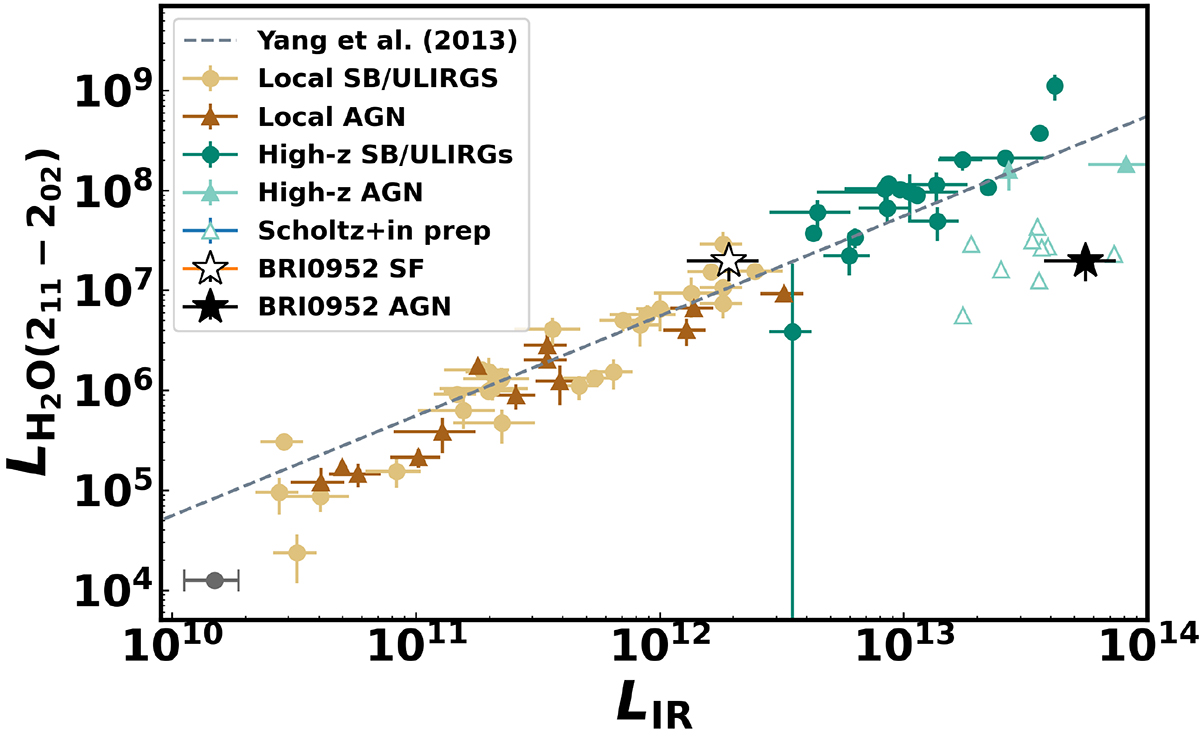
Fig. 13.
Download original image
H2O-LIR relationship with BRI 0952. The dark gray point in the bottom left of the plot shows the indicative error of 30% on the LIR due to discrepancies in reporting LIR vs. LFIR in the literature. The samples shown are from Riechers et al. (2013), Yang et al. (2013, 2016), Falstad et al. (2015), Liu et al. (2017, and in prep.), Casey et al. (2019), Apostolovski et al. (2019), Pensabene et al. (2022), and Scholtz et al. (2023, and in prep.).
Current usage metrics show cumulative count of Article Views (full-text article views including HTML views, PDF and ePub downloads, according to the available data) and Abstracts Views on Vision4Press platform.
Data correspond to usage on the plateform after 2015. The current usage metrics is available 48-96 hours after online publication and is updated daily on week days.
Initial download of the metrics may take a while.