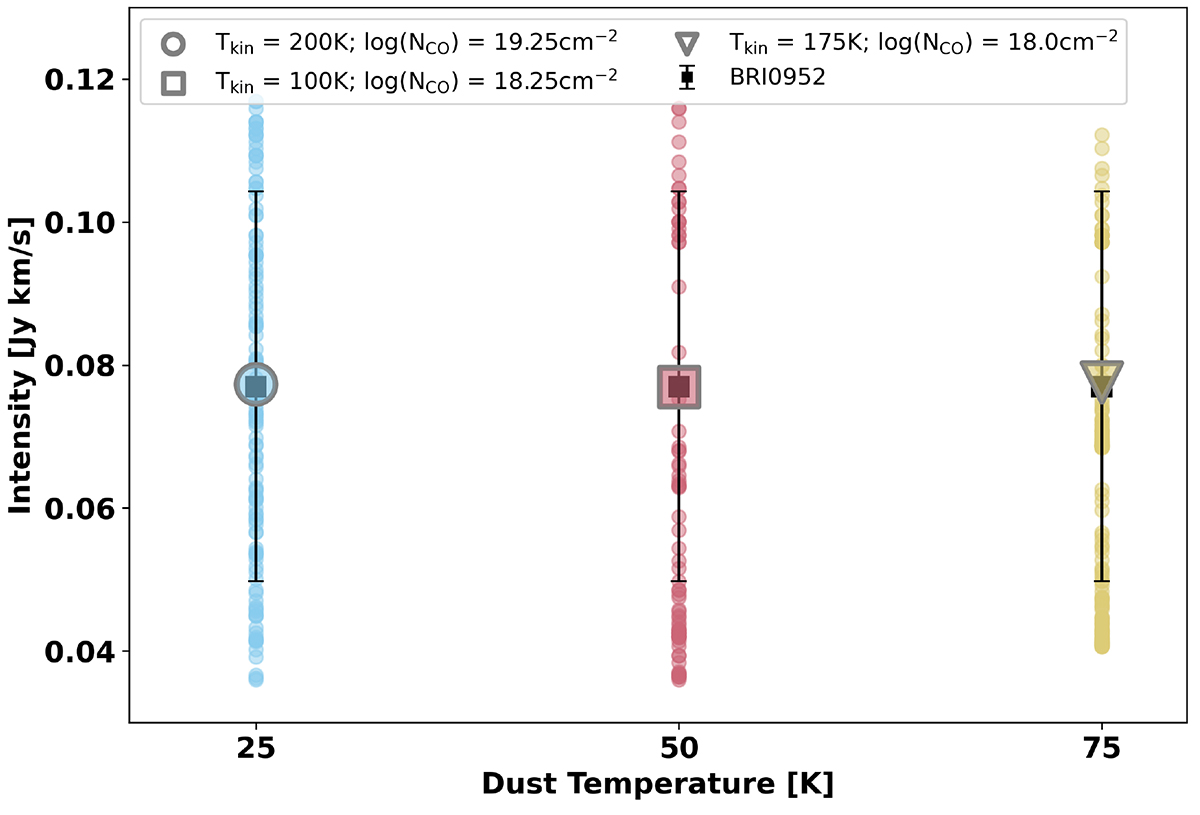
Fig. 12.
Download original image
MOLPOP-CEP modeling of the H2O (211 − 202) line as a function of different modeled dust temperatures. The gray circle, square, and triangle show the absolute best fit model, respectively. The smaller colored circles show the 1σ distribution. Note that the error on the magnification factor is not propagated through to the error on the intensity.
Current usage metrics show cumulative count of Article Views (full-text article views including HTML views, PDF and ePub downloads, according to the available data) and Abstracts Views on Vision4Press platform.
Data correspond to usage on the plateform after 2015. The current usage metrics is available 48-96 hours after online publication and is updated daily on week days.
Initial download of the metrics may take a while.