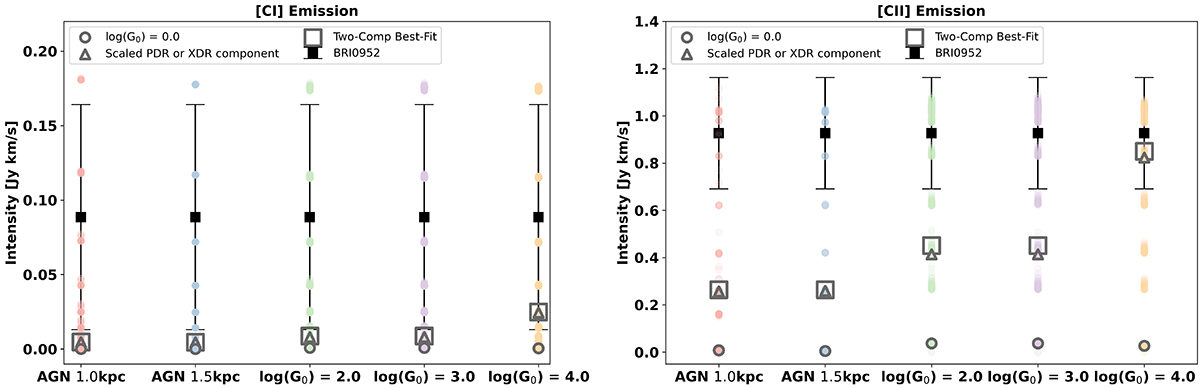
Fig. 10.
Download original image
Best-fit MOLPOP-CEP CO model applied to the [C I] and [C II] emission. The different two-component model is given in the x-axis of the plot, the squares show the absolute lowest χ2 model from the CO emission (i.e., the black lines in Fig. 8), the triangle shows the contribution from the scaled PDR or XDR model contributing to the high-J transitions, likewise the circle shows the contribution from the PDR log(G0) = 0.0 component, and the lightly colored circles show models within 1σ of the lowest χ2. Note that the error on the magnification factor is not propagated through to the error on the intensity.
Current usage metrics show cumulative count of Article Views (full-text article views including HTML views, PDF and ePub downloads, according to the available data) and Abstracts Views on Vision4Press platform.
Data correspond to usage on the plateform after 2015. The current usage metrics is available 48-96 hours after online publication and is updated daily on week days.
Initial download of the metrics may take a while.