Fig. 8.
Download original image
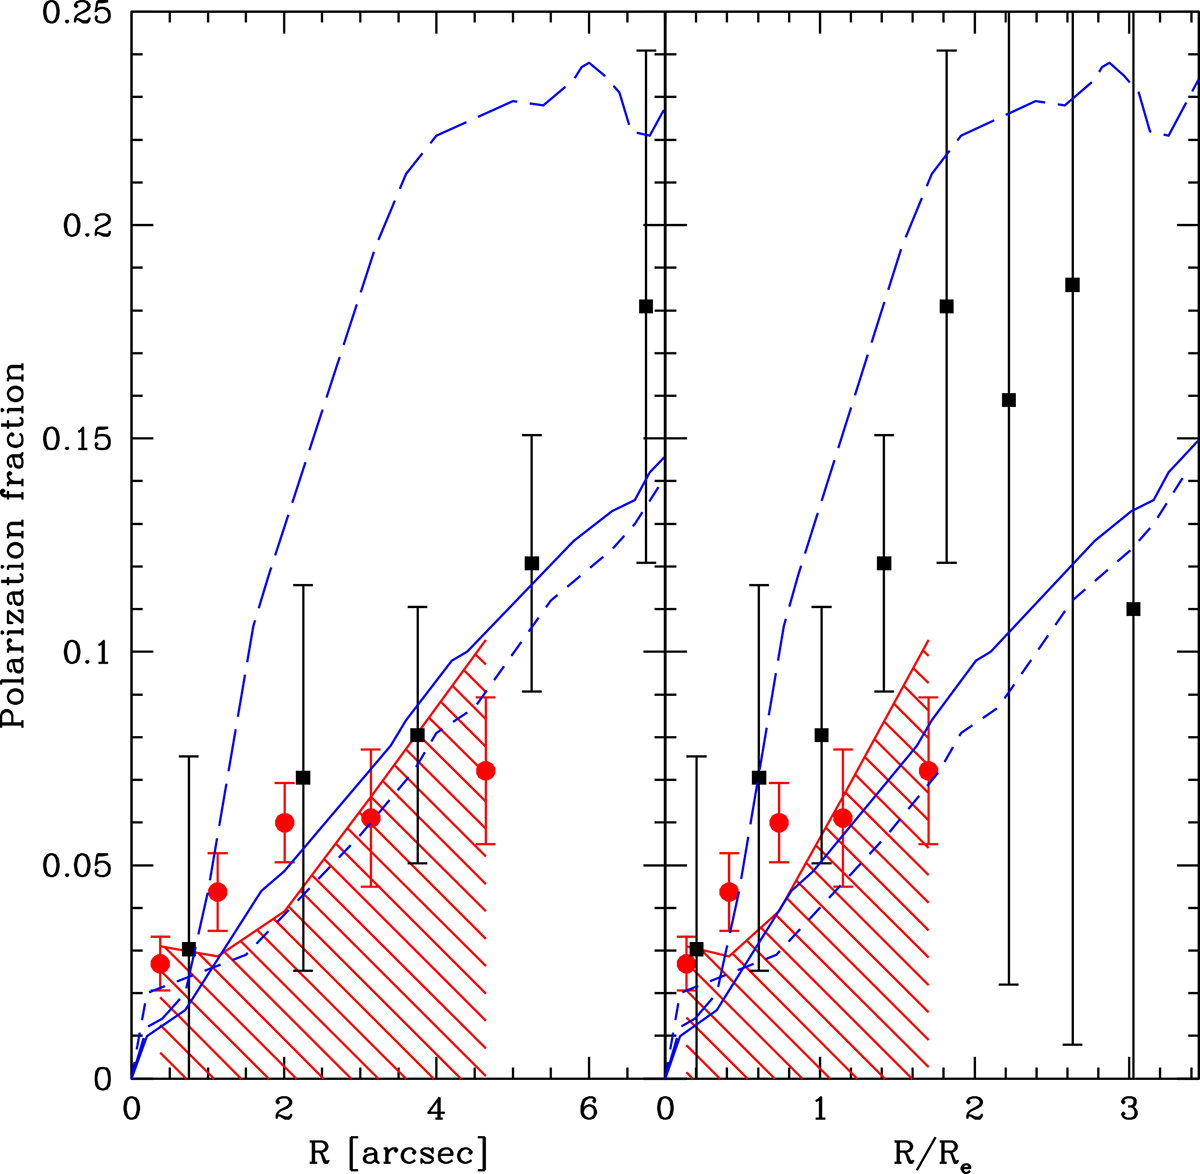
Average polarization fraction in successive annuli as a function of radius. Left panel: radius expressed in arcseconds. Red dots: this work. The statistical correction for the effect of noise (see text) was applied. The error bars are the rms standard deviation of the P values in the eight sectors corresponding to each radius, divided by ![]() . The hatched area below the red line represents the region in which the measured polarization fraction will lie with a 95% probability if the real polarization fraction is zero. We note that two of our measurements lie just above the red line, showing marginally significant signal, while the others lie below the red line and are thus consistent with no polarization. Black square dots: polarization fraction measured by Hayes et al. (2011) for LAB1 in the SSA22 area. Blue lines: theoretical predictions by Trebitsch et al. (2016) for a synthetic LAB at redshift z = 3. Short-dashed line: median polarization profile corresponding to the “extragalactic” Lyα emission (from gas with nH < 0.76 cm−3 number density). Long-dashed line: same as above, but for the “galactic” emission (from H II regions in the central galaxy). Continuous line: same as above, but for the overall Lyα emission. Right panel: same as left panel, but with radius expressed in units or half-light radius Re, with Re = 2.71″ for our object, 2.09″ for the simulation, and 3.71″ for LAB1 (see text). The three black points beyond R/Re = 2 are omitted in the left panel because they lie beyond the limit.
. The hatched area below the red line represents the region in which the measured polarization fraction will lie with a 95% probability if the real polarization fraction is zero. We note that two of our measurements lie just above the red line, showing marginally significant signal, while the others lie below the red line and are thus consistent with no polarization. Black square dots: polarization fraction measured by Hayes et al. (2011) for LAB1 in the SSA22 area. Blue lines: theoretical predictions by Trebitsch et al. (2016) for a synthetic LAB at redshift z = 3. Short-dashed line: median polarization profile corresponding to the “extragalactic” Lyα emission (from gas with nH < 0.76 cm−3 number density). Long-dashed line: same as above, but for the “galactic” emission (from H II regions in the central galaxy). Continuous line: same as above, but for the overall Lyα emission. Right panel: same as left panel, but with radius expressed in units or half-light radius Re, with Re = 2.71″ for our object, 2.09″ for the simulation, and 3.71″ for LAB1 (see text). The three black points beyond R/Re = 2 are omitted in the left panel because they lie beyond the limit.
Current usage metrics show cumulative count of Article Views (full-text article views including HTML views, PDF and ePub downloads, according to the available data) and Abstracts Views on Vision4Press platform.
Data correspond to usage on the plateform after 2015. The current usage metrics is available 48-96 hours after online publication and is updated daily on week days.
Initial download of the metrics may take a while.