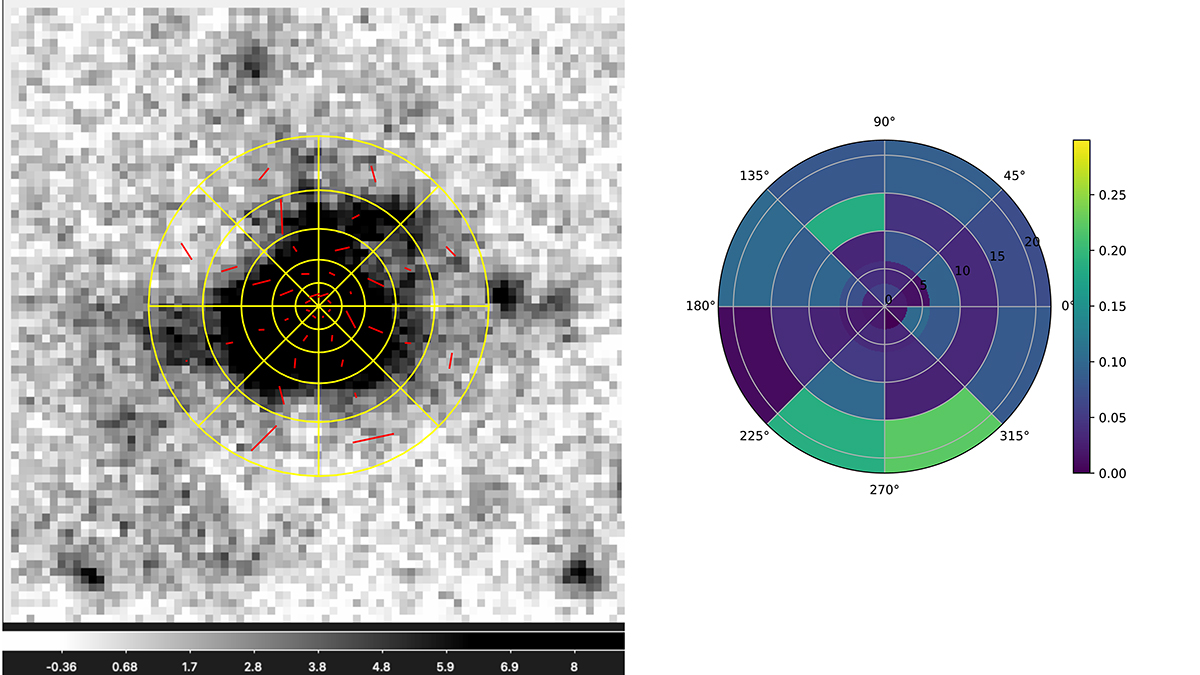
Fig. 5.
Download original image
Polarization signal in sectors of successive annuli of increasing radius around the quasar. Left: definition of the sectors on the average LAB image. The first “annulus” is actually a disk with a three-pixel (0.75″) radius, while the other annuli have an outer radius of 1.5, 2.5, 3.75, and 5.5″, respectively. The red segments indicate the polarization fraction through their length and the polarization angle through their orientation. The background image is a median stack of the 200 individual images corresponding to the two beams, four angles, and 25 exposures. The corresponding intensity bar is in electron units, representing the average flux received during 500 s and corrected for atmospheric extinction. Right: map of polarization fraction. The latter was corrected statistically using Eq. (A3) of Wardle & Kronberg (1974), but spurious polarization still appears in some sectors with low signal (e.g., the outermost one between 270 and 315°).
Current usage metrics show cumulative count of Article Views (full-text article views including HTML views, PDF and ePub downloads, according to the available data) and Abstracts Views on Vision4Press platform.
Data correspond to usage on the plateform after 2015. The current usage metrics is available 48-96 hours after online publication and is updated daily on week days.
Initial download of the metrics may take a while.