Fig. 4.
Download original image
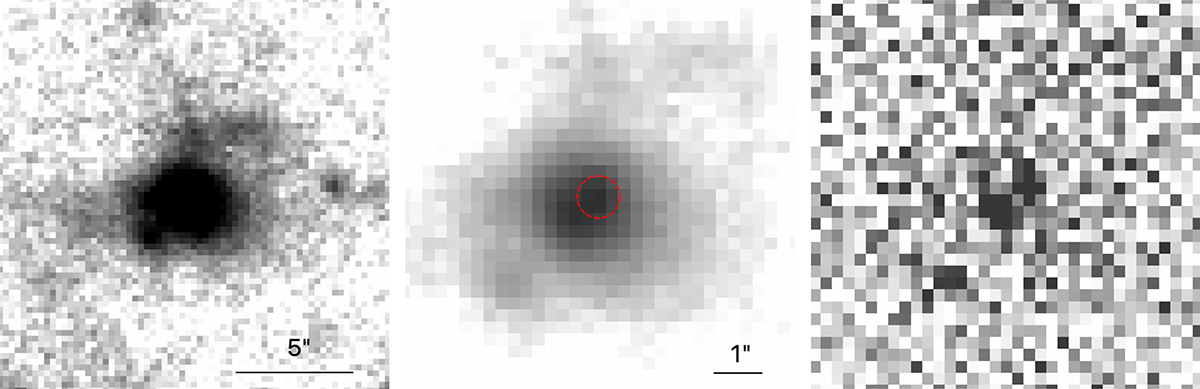
Central structure of LAB, with north up and east left. On the left is the extended low-surface-brightness structures around the quasar. The middle panel shows a zoomed-in view of the central parts after subtraction of the point-source component of the image following the deconvolution of all frames with STARRED. The image is a stack of all quasar-subtracted images (see text) and the position of the point-source component is shown as a red circle. This image is at the spatial resolution of the original data. We note the double structure of the flux distribution. The north-west maximum corresponds to the position of the quasar that has been subtracted, while the SE maximum has no direct connection with the quasar. The right panel shows the stacked residuals with cut levels spanning −3σ to +3σ. We note that while a structure is seen in the center, it is quantitatively negligible.
Current usage metrics show cumulative count of Article Views (full-text article views including HTML views, PDF and ePub downloads, according to the available data) and Abstracts Views on Vision4Press platform.
Data correspond to usage on the plateform after 2015. The current usage metrics is available 48-96 hours after online publication and is updated daily on week days.
Initial download of the metrics may take a while.