Fig. 3.
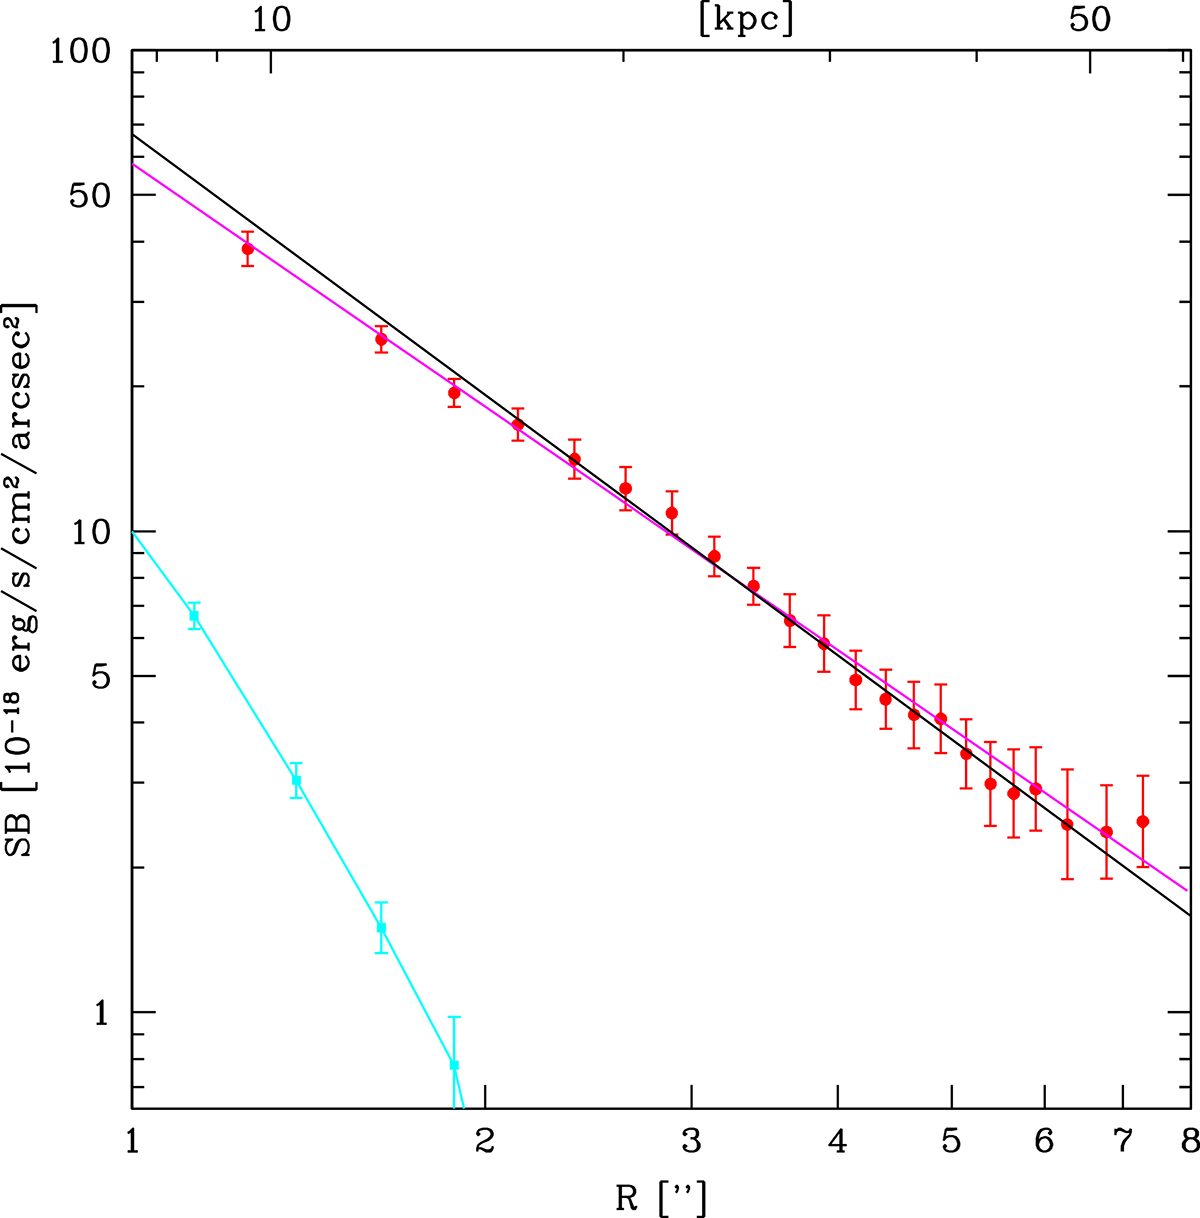
Download original image
Same as Fig. 2, but with a logarithmic scale on both axes, and starting only from R = 1″. The regression line shown in magenta is computed from the red dots displayed here, discarding the dot at R ≃ 4 kpc. The black line shows the power law with an index −1.8, corresponding to the average SB profiles of the blobs studied by Borisova et al. (2016). The stellar profile is shown in cyan.
Current usage metrics show cumulative count of Article Views (full-text article views including HTML views, PDF and ePub downloads, according to the available data) and Abstracts Views on Vision4Press platform.
Data correspond to usage on the plateform after 2015. The current usage metrics is available 48-96 hours after online publication and is updated daily on week days.
Initial download of the metrics may take a while.