Fig. 2.
Download original image
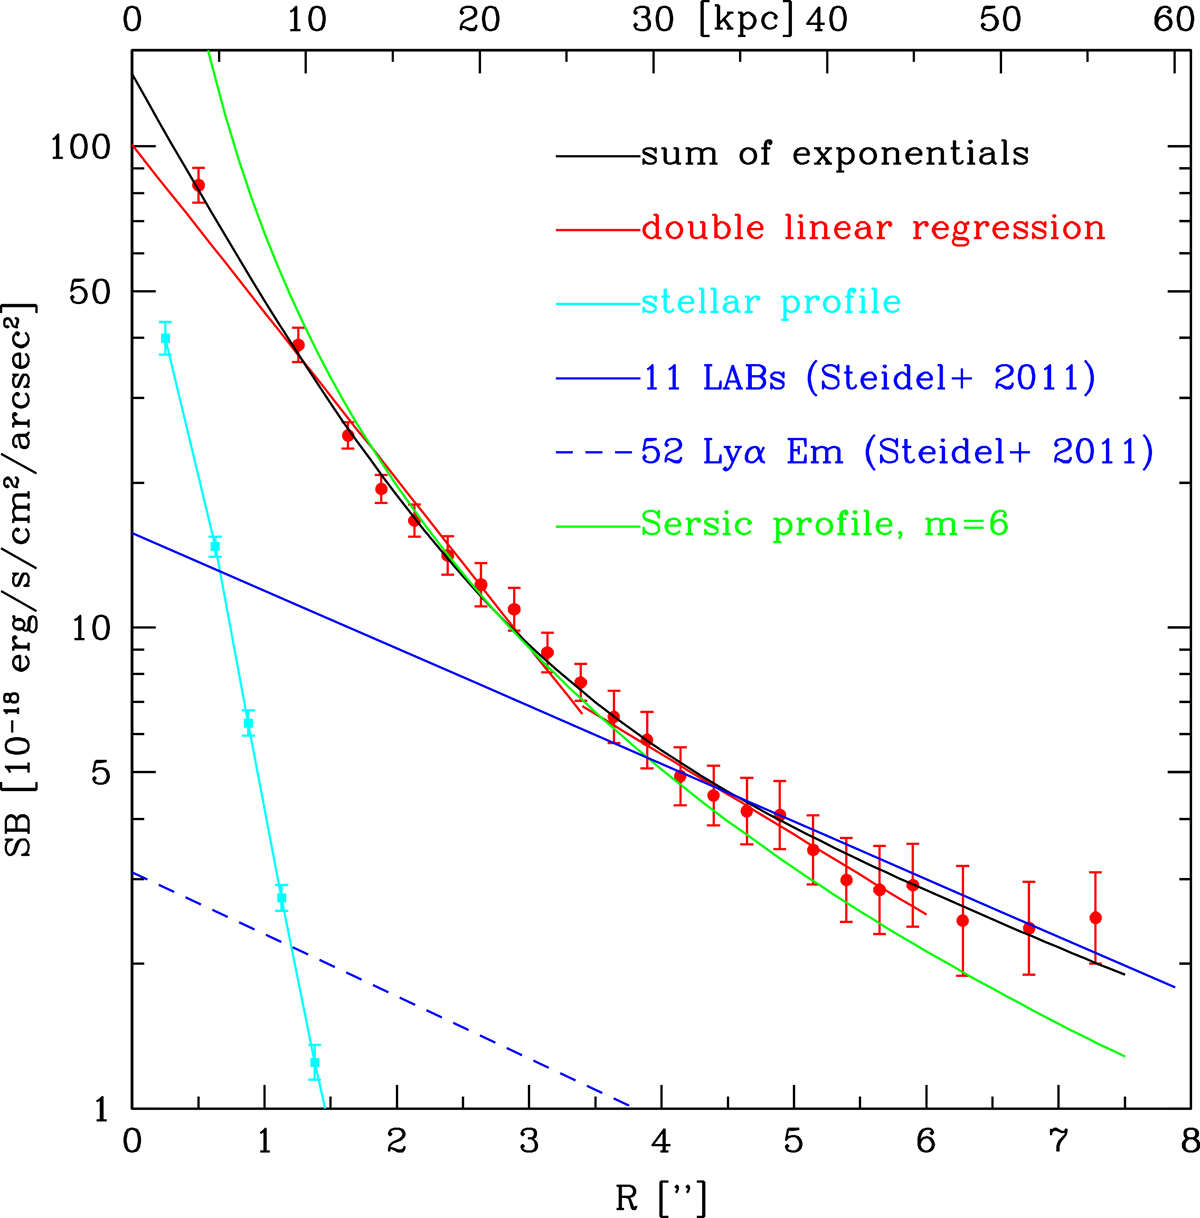
Average surface brightness (SB) as function of radius. Each radius value is the arithmetic mean of the two bounding radii of the corresponding annulus (e.g., R = 2 pixels ≃ 0.5″ for the central R < 4 pixel disk and R = 5 pixels for the 4 ≤ R < 6 pixel annulus). The error bars represent the rms scatter of the pixel values in the corresponding annulus; it includes not only the shot noise, but also the cosmic SB variation within the annulus. The two red regression lines are those given by Eqs. (6) and (7). The black curve is the fit of a sum of two exponentials (Eq. (10)), while the green one is a Sérsic profile with index m = 6; the cyan curve is a stellar profile (see text). The solid blue line is the fit to the average SB profile of the 11 LABs considered by Steidel et al. (2011), while the broken blue line is the same for the 52 galaxies with Lyα in emission (Steidel et al. 2011).
Current usage metrics show cumulative count of Article Views (full-text article views including HTML views, PDF and ePub downloads, according to the available data) and Abstracts Views on Vision4Press platform.
Data correspond to usage on the plateform after 2015. The current usage metrics is available 48-96 hours after online publication and is updated daily on week days.
Initial download of the metrics may take a while.