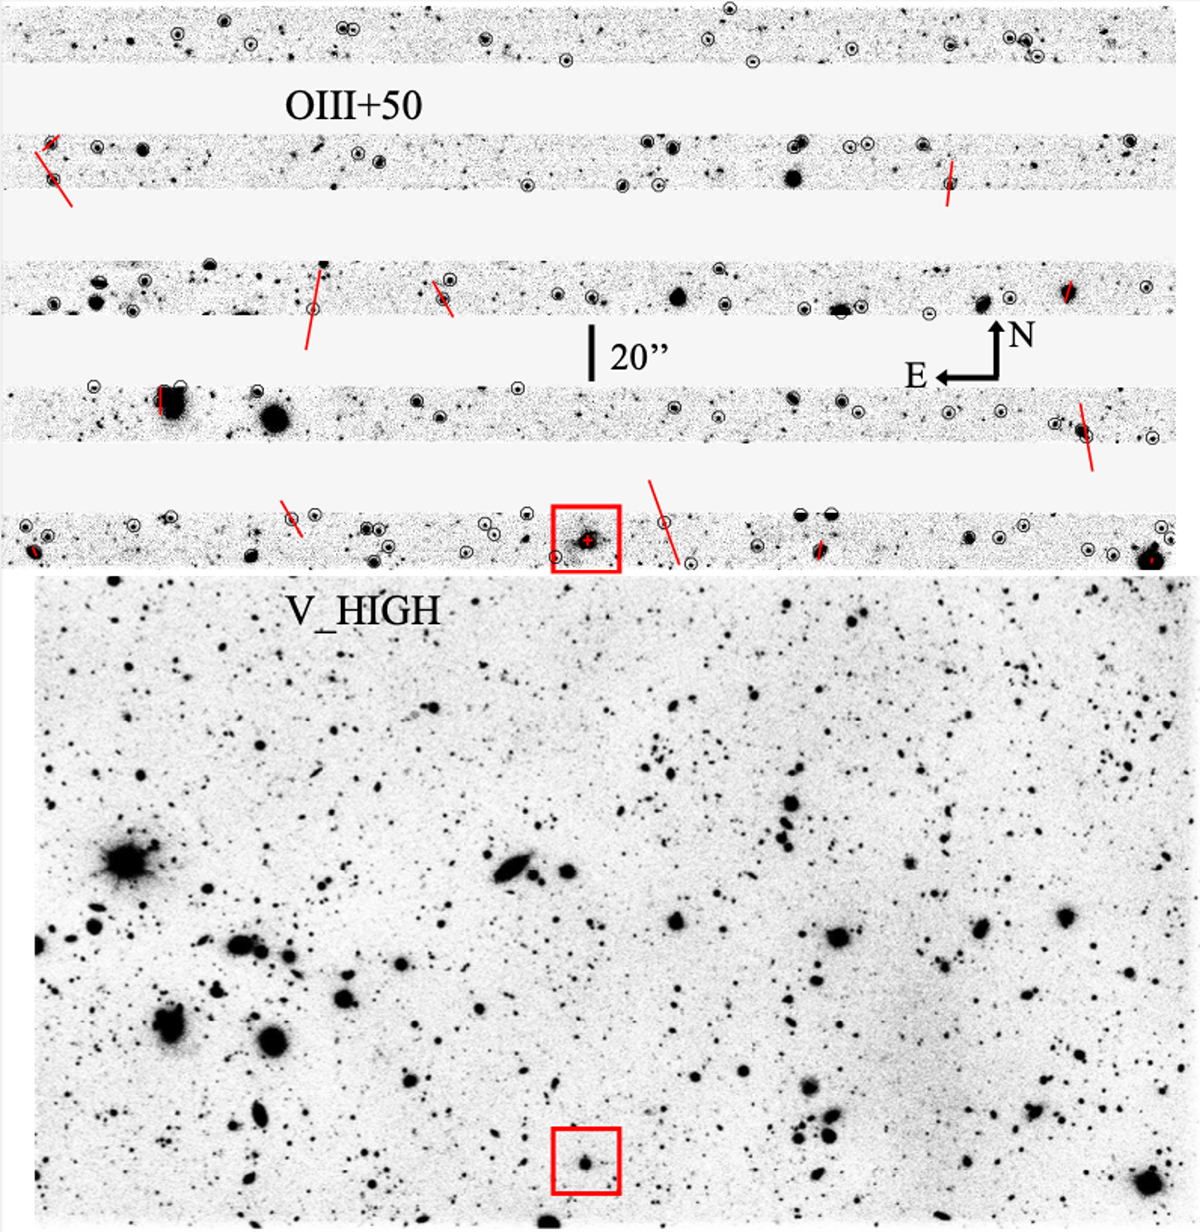
Fig. 1.
Download original image
Field covered by the CHIP1 detector, through the NB filter and through the wide-band filter. Upper panel: total intensity image in redshifted Lyα band, obtained by coadding all images corresponding to all four polariser angles and to both ordinary and extraordinary beams, as recorded on the CHIP1 detector. The total equivalent exposure time is 13 h, 53 min, and 20 s. The five bands correspond to the positions of the ordinary beam; the bands where the extraordinary beam falls appear blank here, because the corresponding images have been aligned and stacked with those of the ordinary beam. This shows that only half of the field is accessible in the polarization mode. The red square indicates and surrounds the LAB image, which includes the overexposed QSO near its center. The black circles designate objects detected at each angle and beam, and for which the polarization was measured. The red segments are the polarization vectors for objects with a polarization fraction of P > 5 σ. Lower panel: total vHIGH intensity image, corresponding to a total exposure time of 26 min, 40 s. The same red square as in the upper panel identifies the QSO. Both frames have the same scale.
Current usage metrics show cumulative count of Article Views (full-text article views including HTML views, PDF and ePub downloads, according to the available data) and Abstracts Views on Vision4Press platform.
Data correspond to usage on the plateform after 2015. The current usage metrics is available 48-96 hours after online publication and is updated daily on week days.
Initial download of the metrics may take a while.