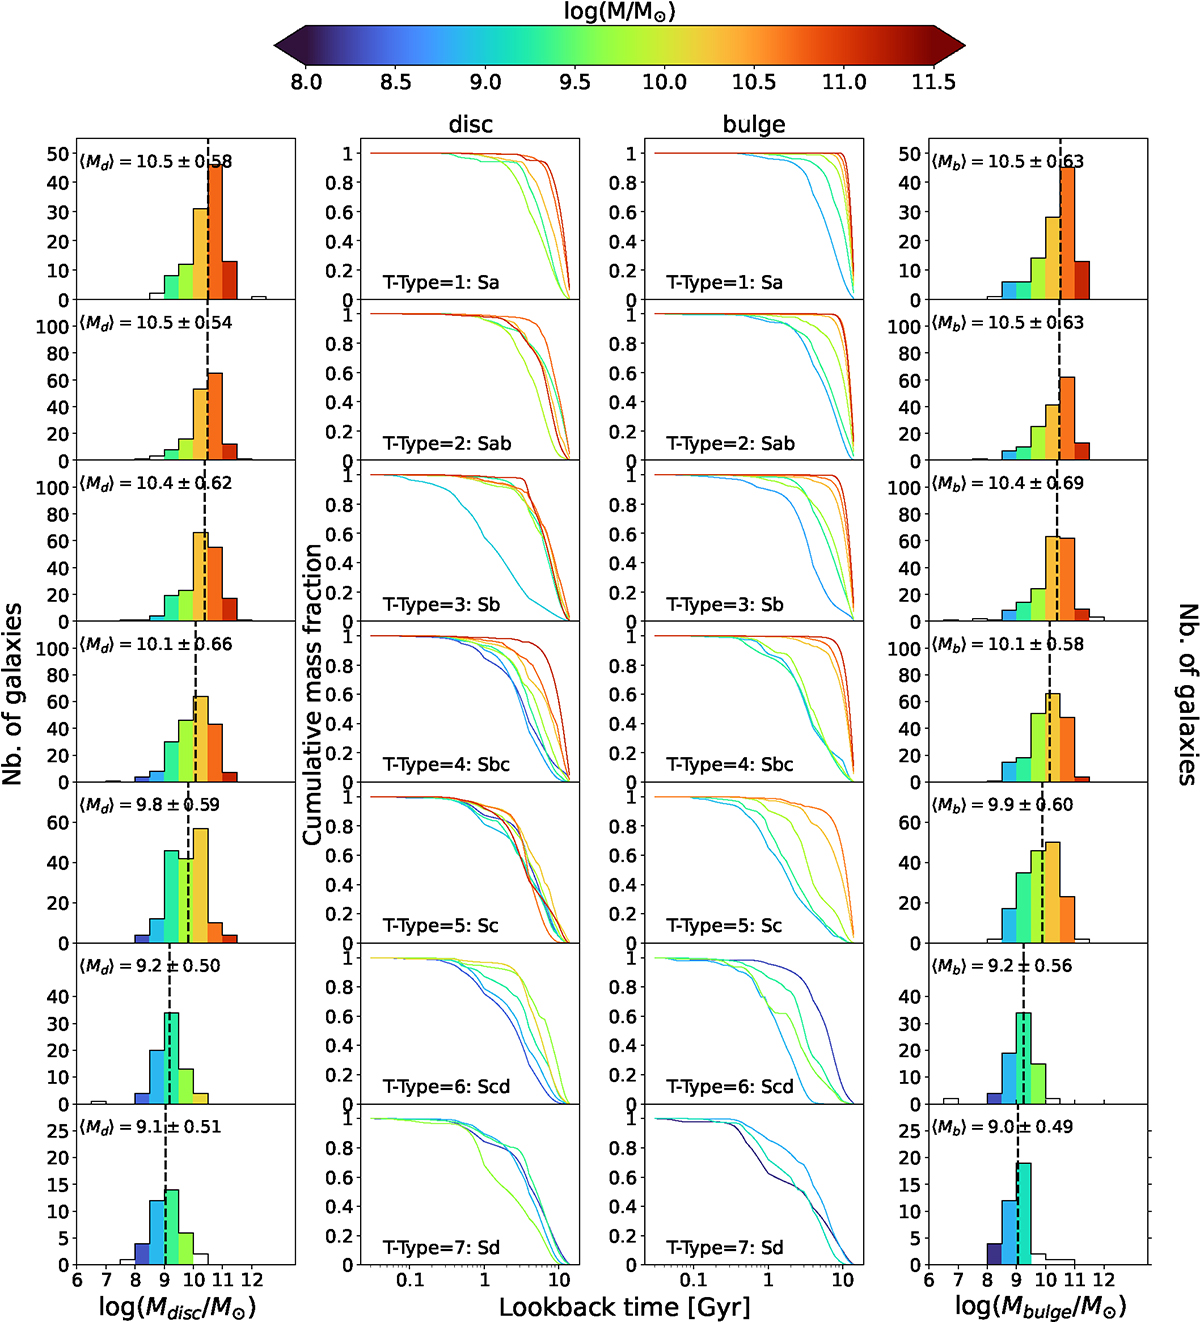
Fig. 8.
Download original image
Dependence of MAH on component stellar mass. Left-most column: disc mass distributions in increasing steps of morphological type (top to bottom panels). Right-most column: bulge mass distributions in increasing steps of morphological type. The vertical dashed line is the median component stellar mass for each type. Centre columns: disc and bulge MAH curves stacked in every corresponding mass bin shown in the histograms. Histogram bins and MAH curves have the same colour-coding, marked by the median mass of bulges or discs in each bin. Bins containing 3 objects or less are shown in white on the histograms, and their corresponding MAH curves have been excluded.
Current usage metrics show cumulative count of Article Views (full-text article views including HTML views, PDF and ePub downloads, according to the available data) and Abstracts Views on Vision4Press platform.
Data correspond to usage on the plateform after 2015. The current usage metrics is available 48-96 hours after online publication and is updated daily on week days.
Initial download of the metrics may take a while.