Open Access
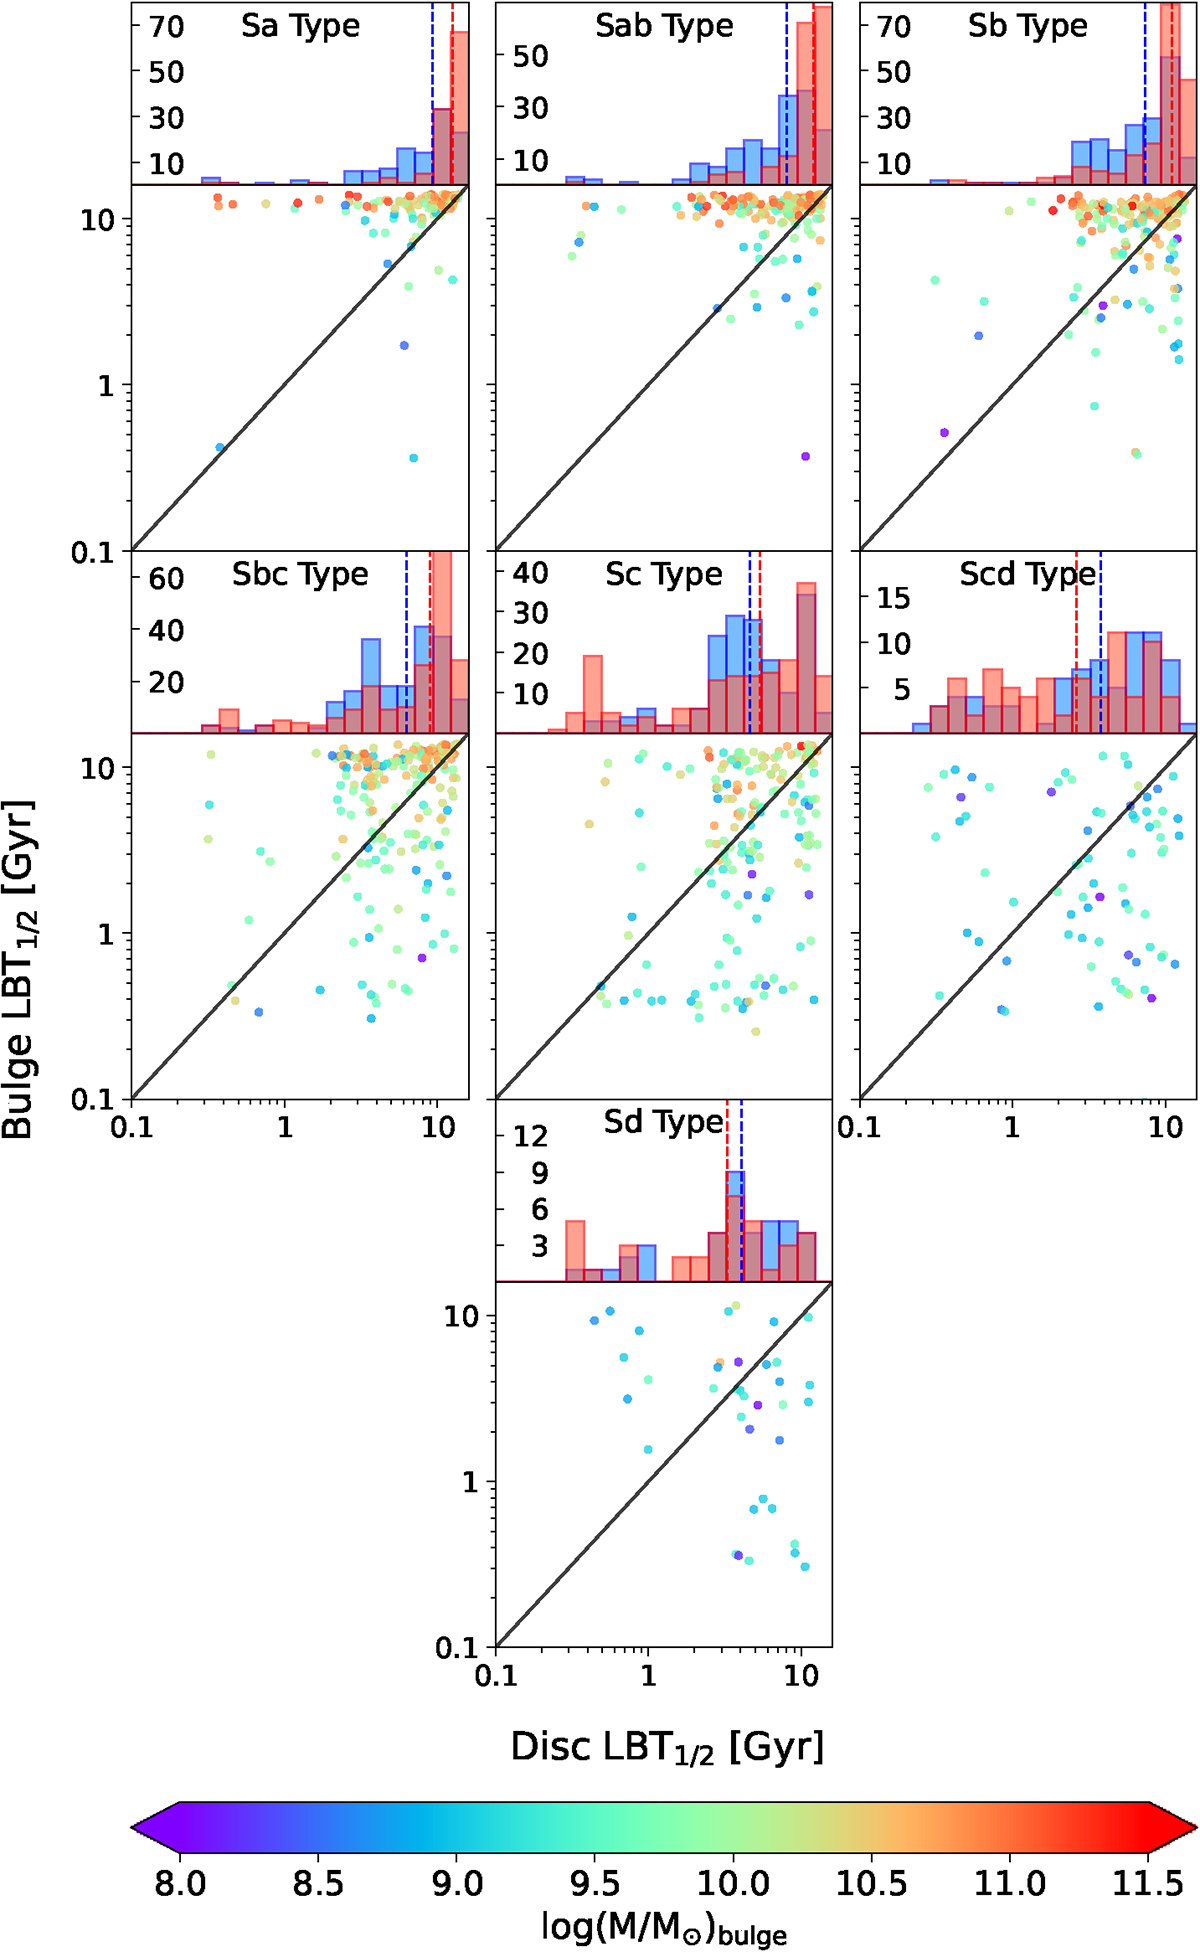
Fig. 7.
Download original image
Formation time of the bulges and discs which marks the time it took to form 50% of the stellar mass, colour-coded by the total stellar mass. The upper panels show the histogram of these formation times for the bulge and disc in red and blue respectively, with their median times in dashed lines.
Current usage metrics show cumulative count of Article Views (full-text article views including HTML views, PDF and ePub downloads, according to the available data) and Abstracts Views on Vision4Press platform.
Data correspond to usage on the plateform after 2015. The current usage metrics is available 48-96 hours after online publication and is updated daily on week days.
Initial download of the metrics may take a while.