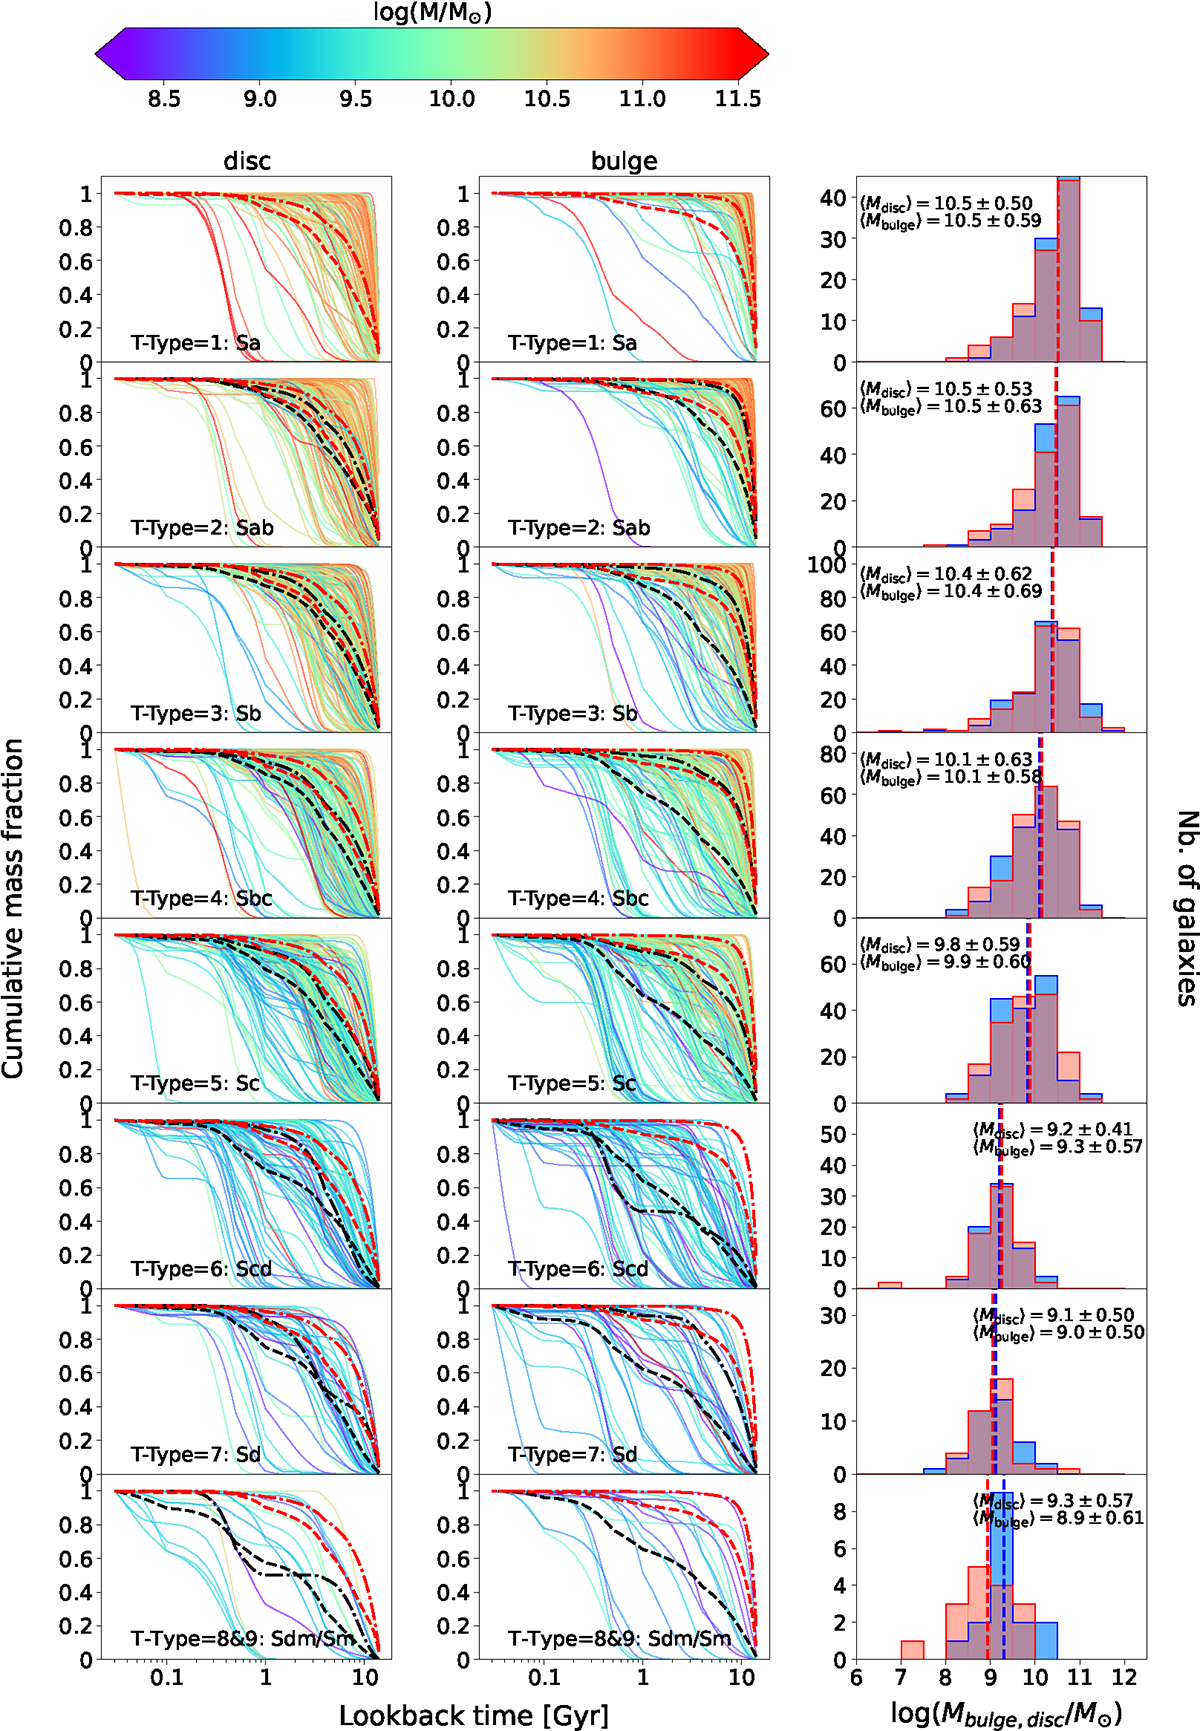
Fig. 6.
Download original image
Individual and global trends of MAH in bulges and discs. Left and centre columns: individual MAHs of spirals separated by increasing T-Types (from top to bottom). In each panel, the mean-stacked MAH for high-mass components (M > 1010 M⊙) are shown as thick black dot-dashed curves, and low-mass components (M < 1010 M⊙) as thick black dashed curves. These are depicted as red dot-dashed and dashed curves respectively for the Sa type (row 1), which also serves as a reference for all following types for easier visual comparison. Right-most column: bulge and disc masses in red and blue, respectively, with their median masses shown by dotted lines.
Current usage metrics show cumulative count of Article Views (full-text article views including HTML views, PDF and ePub downloads, according to the available data) and Abstracts Views on Vision4Press platform.
Data correspond to usage on the plateform after 2015. The current usage metrics is available 48-96 hours after online publication and is updated daily on week days.
Initial download of the metrics may take a while.