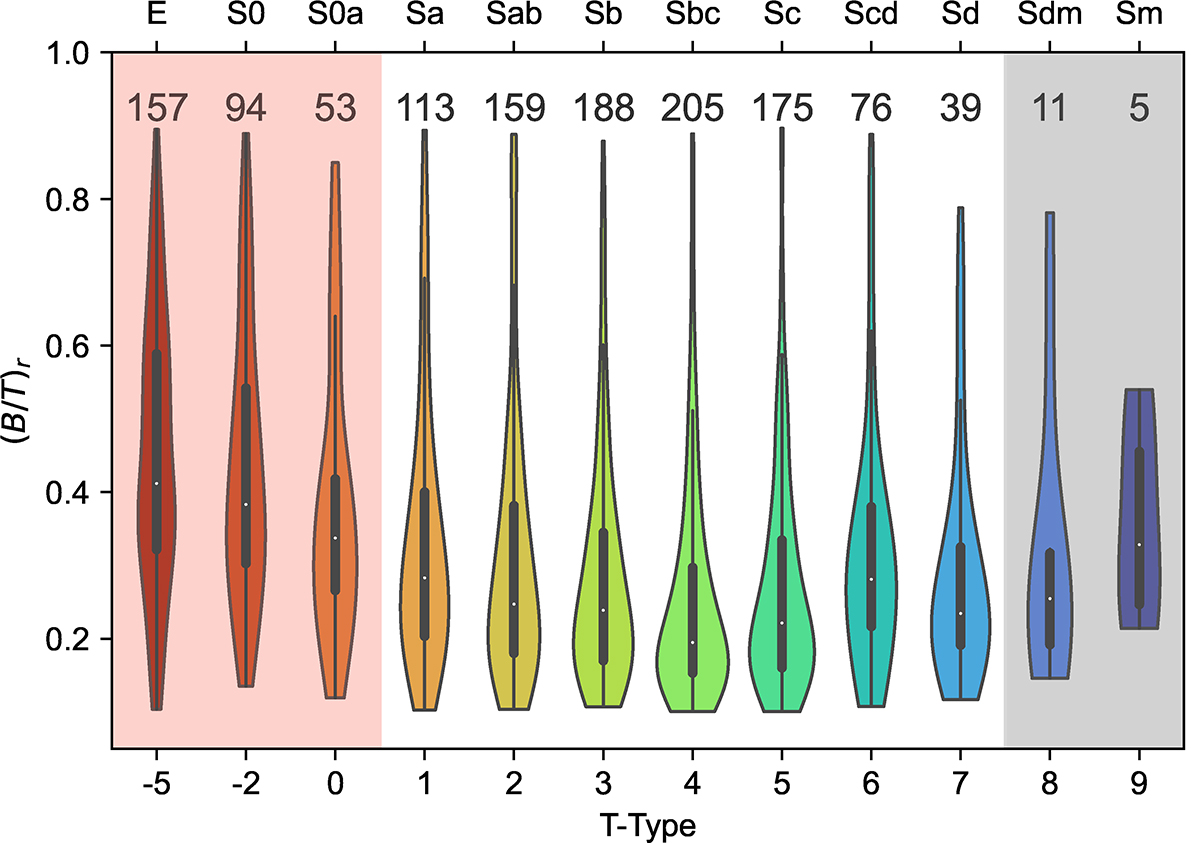
Fig. 5.
Download original image
Bulge-to-total ratio of all galaxies in the r-band, as a function of morphology. The lower x-axis is labelled by the T-Type index, and the upper x-axis by the corresponding Hubble types. The inner parts of the violins contain a box and whisker plot. The white circles in the violin plots represent the median bulge-to-total ratios, while the thick black bar defines the interquartile (25th–75th percentile) range of the distribution. The limits on the thin black bar extend to 1.5 times the interquartile range. The upper and lower ends of the violins mark the highest and lowest values of (B/T)r in each T-Type. The number of galaxies in each T-Type is denoted on top of its corresponding violin. The region shaded in red depicts the early-type galaxies (ETGs: E, S0, and S0a), that are not part of this analysis, which concentrates on the types with the white background. The ETGs will be discussed in a different publication. The region marked in grey with the late-type spiral galaxies (Sdm and Sm) are highlighted due to their very low numbers. Additionally, these are visually harder to separate as two distinct morphologies, and will be merged together in certain plots in the analysis.
Current usage metrics show cumulative count of Article Views (full-text article views including HTML views, PDF and ePub downloads, according to the available data) and Abstracts Views on Vision4Press platform.
Data correspond to usage on the plateform after 2015. The current usage metrics is available 48-96 hours after online publication and is updated daily on week days.
Initial download of the metrics may take a while.