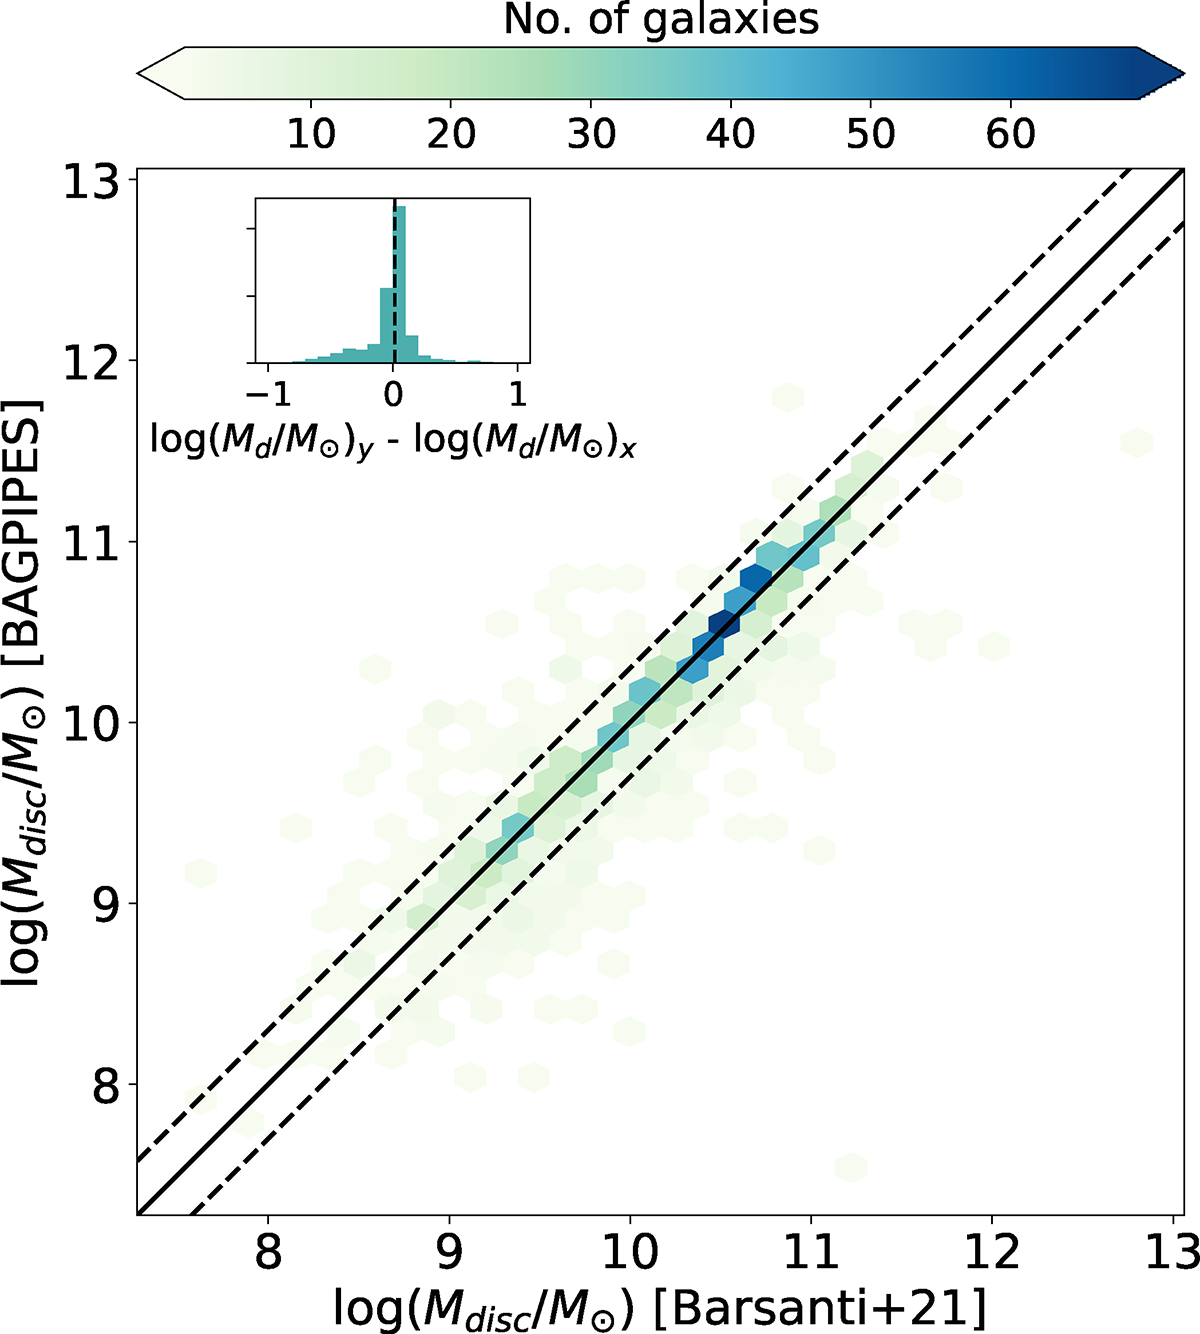
Fig. 2.
Download original image
Density plot of the disc masses estimated by BAGPIPES and the colour–mass relation in Barsanti et al. (2021). The black diagonal line shows the 1:1 correspondence, and the dashed lines mark the ±0.3 dex offset from it. The inset shows the distribution of the difference between each BAGPIPES estimate and the CMR estimate, with the black dashed vertical line marking the median offset.
Current usage metrics show cumulative count of Article Views (full-text article views including HTML views, PDF and ePub downloads, according to the available data) and Abstracts Views on Vision4Press platform.
Data correspond to usage on the plateform after 2015. The current usage metrics is available 48-96 hours after online publication and is updated daily on week days.
Initial download of the metrics may take a while.