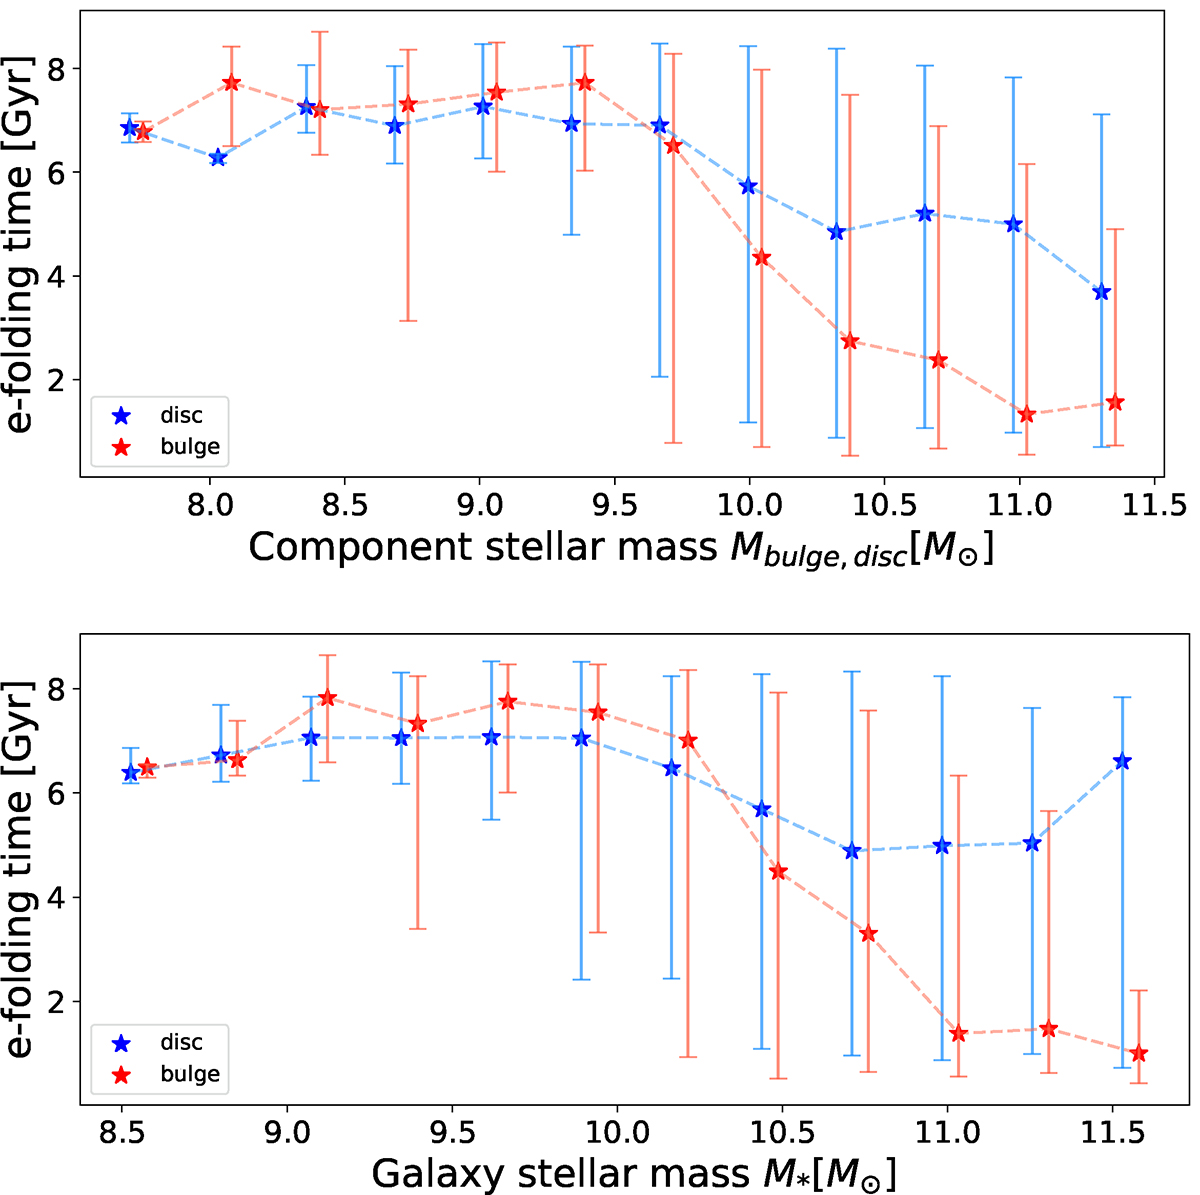
Fig. A.1.
Download original image
Dependence of e-folding time as a function of stellar mass. Upper panel: Variation of e-folding times of bulges τbulge (red) and discs τdisc (blue) as a function of their corresponding component stellar masses. The stars represent the median value in each mass bin, and the error bars show the 16th-84th percentile range in the spread of values in each bin. Lower panel: Similar to above but with the total galaxy stellar mass along the x-axis. In both panels, the τbulge was shifted by 0.05 dex for clarity in visualisation.
Current usage metrics show cumulative count of Article Views (full-text article views including HTML views, PDF and ePub downloads, according to the available data) and Abstracts Views on Vision4Press platform.
Data correspond to usage on the plateform after 2015. The current usage metrics is available 48-96 hours after online publication and is updated daily on week days.
Initial download of the metrics may take a while.